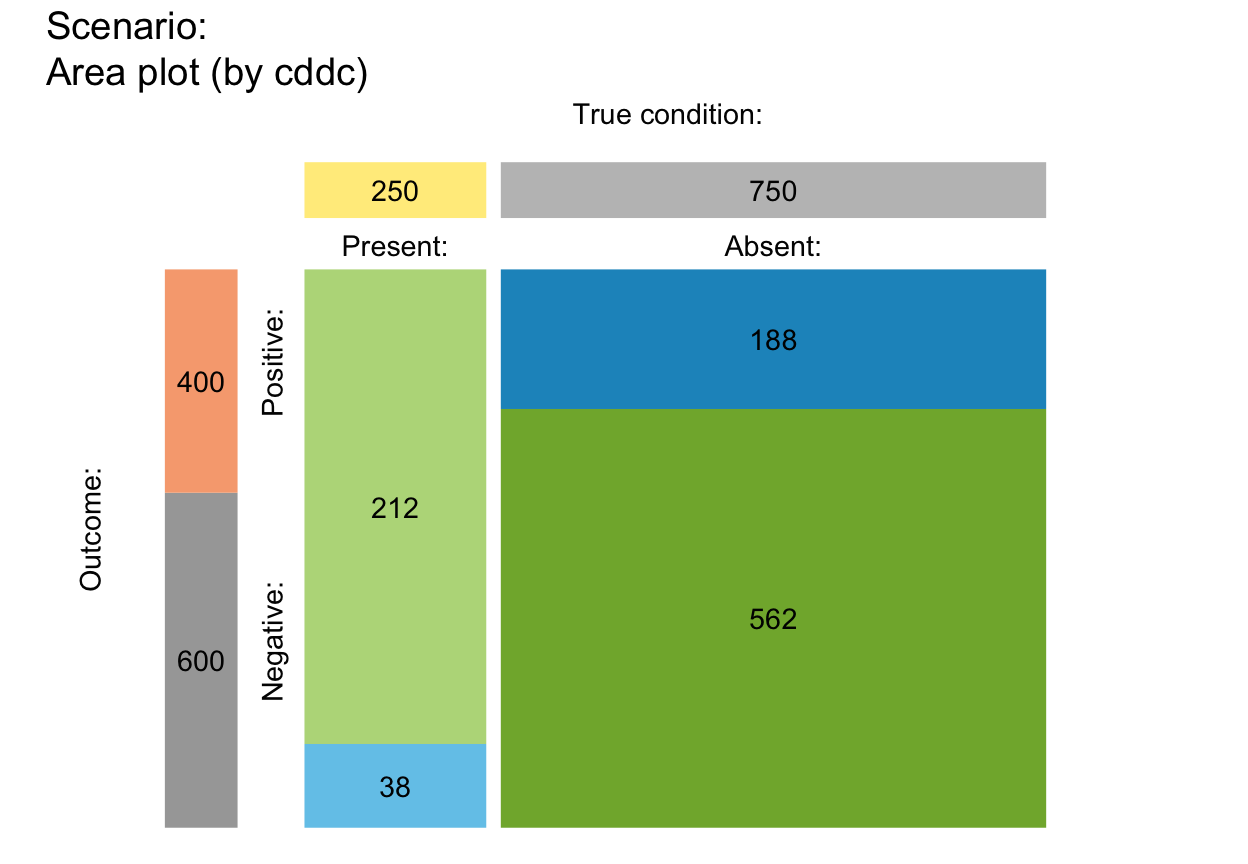
plot_mosaic drew a mosaic plot that
represents the proportions of frequencies in the current
population as relatives sizes of rectangular areas.
Usage
plot_mosaic(
  prev = num$prev,
  sens = num$sens,
  mirt = NA,
  spec = num$spec,
  fart = NA,
  N = num$N,
  by = "cddc",
  show_accu = TRUE,
  w_acc = 0.5,
  title_lbl = txt$scen_lbl,
  col_sdt = c(pal["hi"], pal["mi"], pal["fa"], pal["cr"])
)
Arguments
- prev
The condition's prevalence
prev.- sens
The decision's sensitivity
sens.- mirt
The decision's miss rate
mirt.- spec
The decision's specificity value
spec.- fart
The decision's false alarm rate
fart.- N
The number of individuals in the population.
- by
A character code specifying the perspective (or categories by which the population is split into subsets) with 3 options:
"cddc"... by condition x decision;"dccd"... by decision x condition;"cdac"... by condition x accuracy.
- show_accu
Option for showing current and exact accuracy metrics
accuin the plot.- w_acc
Weighting parameter
wused to compute weighted accuracy.- title_lbl
Text label for current plot title.
- col_sdt
Colors for cases of 4 essential frequencies. Default:
col_sdt = c(pal["hi"], pal["mi"], pal["fa"], pal["cr"]).
Details
plot_mosaic is deprecated – please use plot_area instead.
See also
plot_area is the new version of this function.
Other visualization functions:
plot.riskyr(),
plot_area(),
plot_bar(),
plot_crisk(),
plot_curve(),
plot_fnet(),
plot_icons(),
plot_plane(),
plot_prism(),
plot_tab(),
plot_tree()