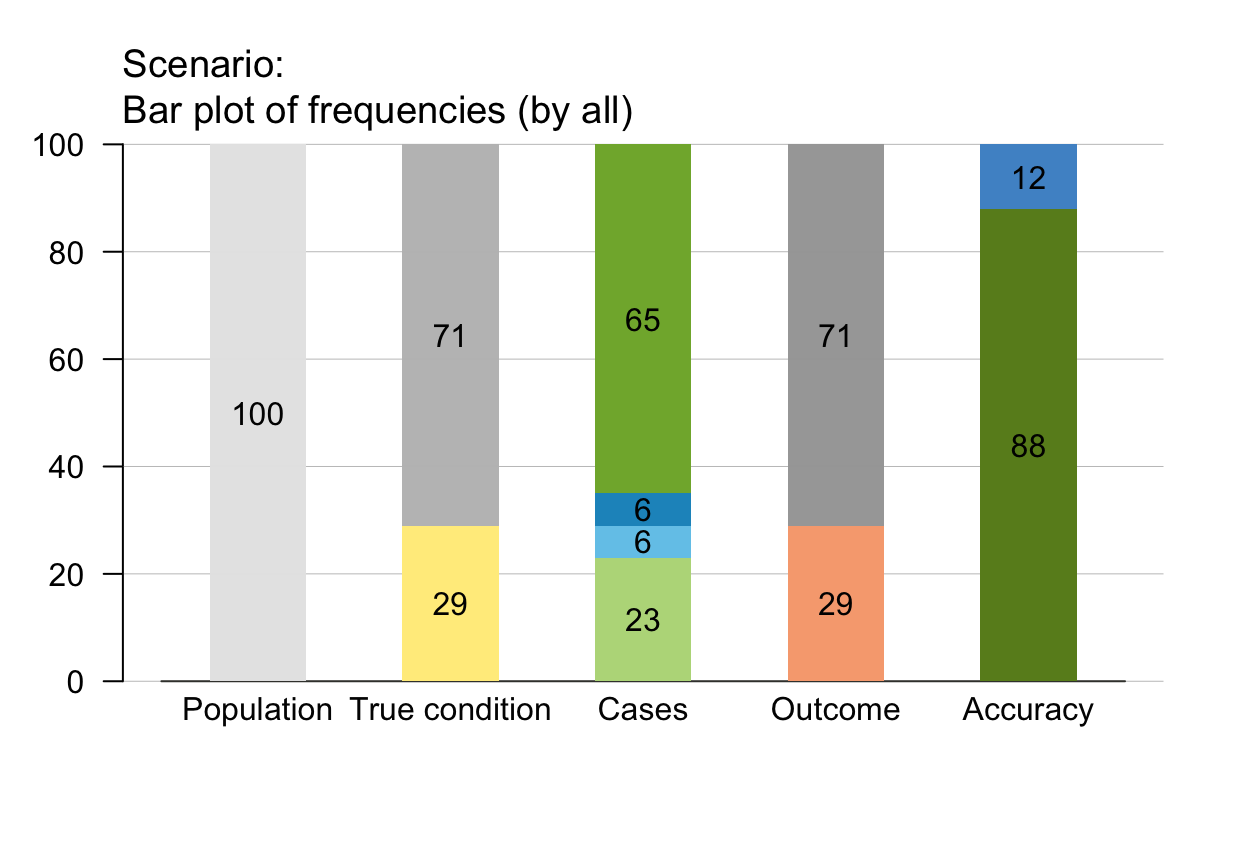
plot_bar draws bar charts that
represent the proportions of frequencies in the current
population popu as relatives sizes of
rectangular areas.
Usage
plot_bar(
  prev = num$prev,
  sens = num$sens,
  mirt = NA,
  spec = num$spec,
  fart = NA,
  N = num$N,
  by = "all",
  dir = 1,
  scale = "f",
  round = TRUE,
  sample = FALSE,
  f_lbl = "num",
  f_lwd = 1,
  lty = 0,
  lbl_txt = txt,
  main = txt$scen_lbl,
  sub = "type",
  title_lbl = NULL,
  col_pal = pal,
  mar_notes = FALSE,
  ...
)
Arguments
- prev
The condition's prevalence
prev(i.e., the probability of condition beingTRUE).- sens
The decision's sensitivity
sens(i.e., the conditional probability of a positive decision provided that the condition isTRUE).sensis optional when its complementmirtis provided.- mirt
The decision's miss rate
mirt(i.e., the conditional probability of a negative decision provided that the condition isTRUE).mirtis optional when its complementsensis provided.- spec
The decision's specificity value
spec(i.e., the conditional probability of a negative decision provided that the condition isFALSE).specis optional when its complementfartis provided.- fart
The decision's false alarm rate
fart(i.e., the conditional probability of a positive decision provided that the condition isFALSE).fartis optional when its complementspecis provided.- N
The number of individuals in the population. (This value is not represented in the plot, but used when new frequency information
freqand a new population tablepopuare computed from scratch from current probabilities.)- by
A character code specifying the perspective (or the dimension by which the population is split into 2 subsets) with the following options:
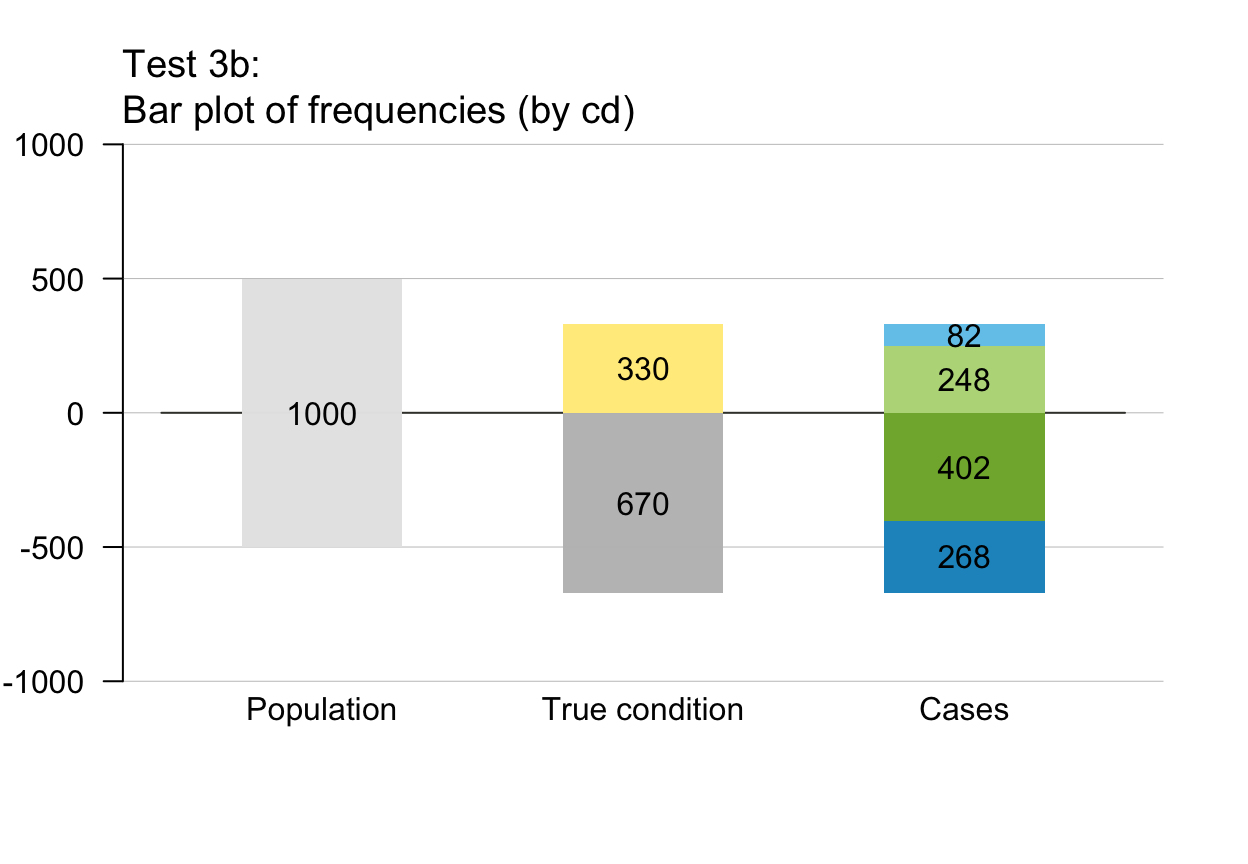
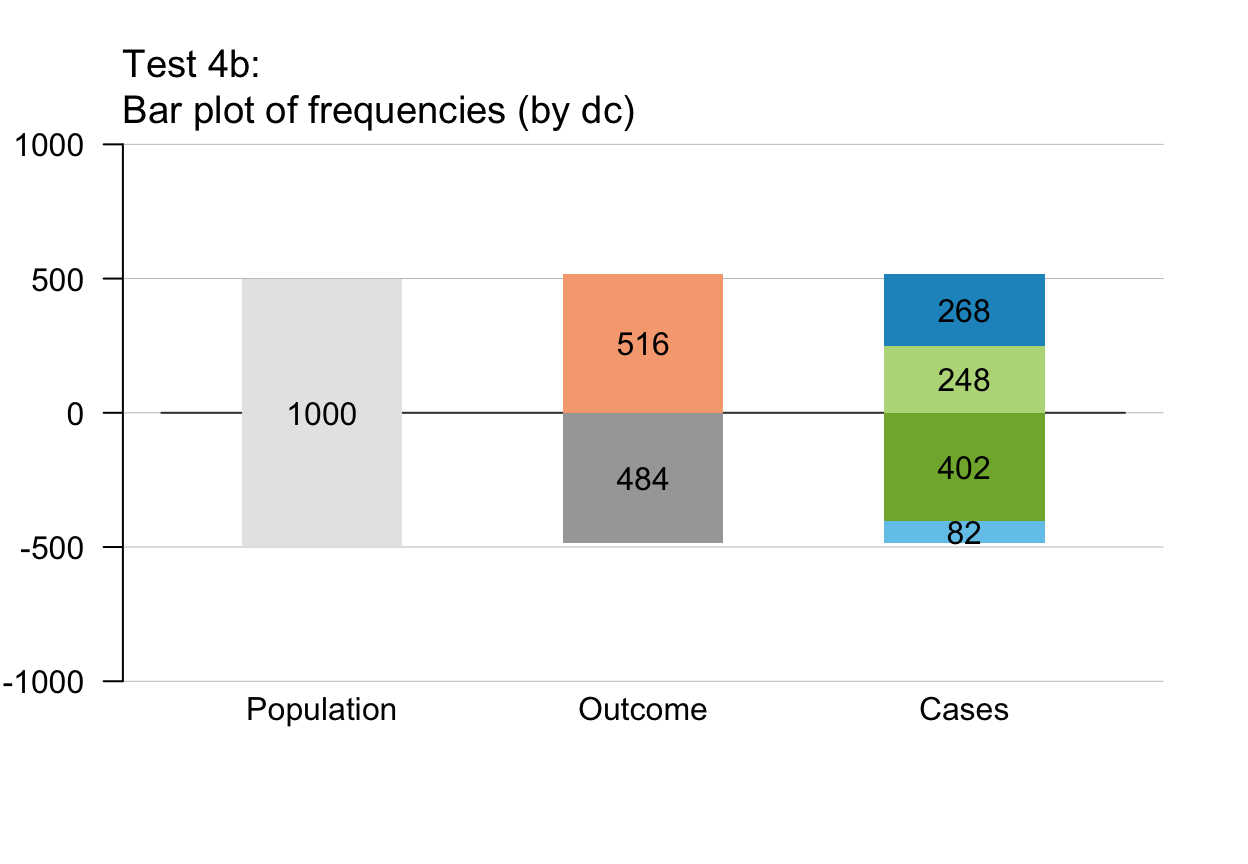
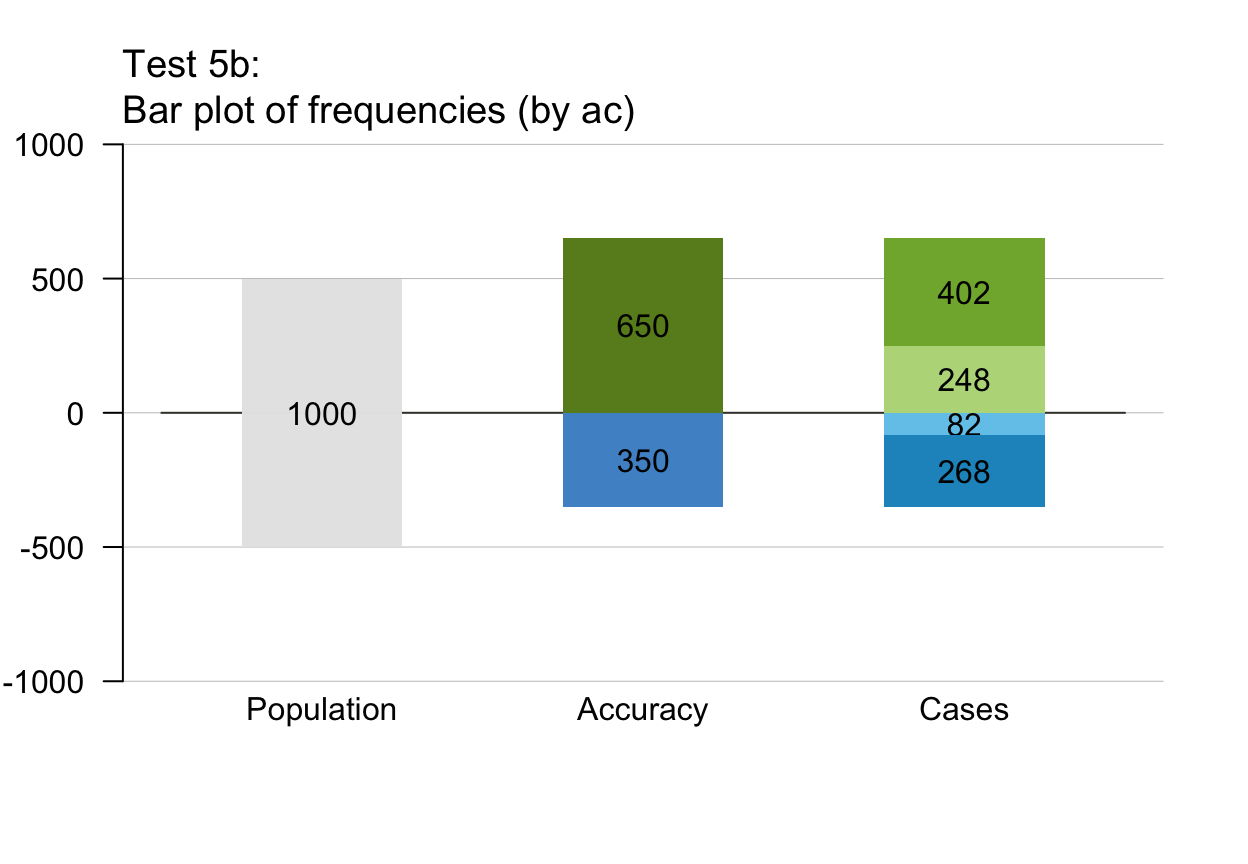
by = "cd": by condition;by = "dc": by decision;by = "ac": by accuracy;by = "all"combines perspectives (5 bars, default).
- dir
Number of directions in which bars are plotted. Options:
dir = 1: uni-directional bars (all up, default);dir = 2: bi-directional bars (up vs. down).
- scale
Scale the heights of bars either by current frequencies (
scale = "f") or by exact probabilities (scale = "p"). Default:scale = "f". For large population sizesNand whenround = FALSE, both settings yield the same bar heights.- round
Boolean option specifying whether computed frequencies are to be rounded to integers. Default:
round = TRUE.- sample
Boolean value that determines whether frequency values are sampled from
N, given the probability values ofprev,sens, andspec. Default:sample = FALSE.- f_lbl
Type of frequency labels, as character code with the following options:
f_lbl = "nam": names;f_lbl = "num": numeric values (default);f_lbl = "abb": abbreviated names;f_lbl = NA/NULL/"no": no labels;f_lbl = "any": abbreviated names and numeric values (abb = num).
- f_lwd
Line width of frequency box (border). Values of
NA/NULL/0setlwdto invisibletiny_lwd <- .001andlty <- 0("blank"). Default:f_lwd = 1.- lty
Line type of frequency box (border). Values of
NA/NULL/0setltytolty <- 0. Default:lty = 0(i.e., no line).- lbl_txt
Current text information (for labels, titles, etc.). Default:
lbl_txt = txt(seeinit_txt).- main
Text label for main plot title. Default:
main = txt$scen_lbl.- sub
Text label for plot subtitle (on 2nd line). Default:
sub = "type"shows information on current plot type.- title_lbl
Deprecated text label for current plot title. Replaced by
main.- col_pal
Current color palette. Default:
col_pal = pal(seeinit_pal).- mar_notes
Boolean option for showing margin notes. Default:
mar_notes = FALSE.- ...
Other (graphical) parameters (e.g.,
cex,font,lty, etc.).
Details
If a sufficient and valid set of 3 essential probabilities
(prev, and
sens or its complement mirt, and
spec or its complement fart)
is provided, new frequency information freq
and a new population table popu
are computed from scratch. Otherwise, the existing
population popu is shown.
By default, plot_bar uses current frequencies
(i.e., rounded or not rounded, depending on the value of round)
as bar heights, rather than using exact probabilities to
scale bar heights (i.e., default scaling is scale = "f").
Using the option scale = "p" scales bar heights
by probabilities (e.g., showing bars for non-natural frequencies
even when frequencies are rounded).
When round = FALSE, bar heights for scale = "f"
and for scale = "p" are identical.
The distinction between scale = "f" and
scale = "p" matters mostly for
small populations sizes N
(e.g., when N < 100).
For rounded and small frequency values (e.g., freq < 10)
switching from scale = "f" to scale = "p"
yields different plots.
plot_bar contrasts compound frequencies along 1 dimension (height).
See plot_mosaic for 2-dimensional visualizations (as areas)
and various box) options in
plot_tree and plot_fnet
for related functions.
See also
comp_popu computes the current population;
popu contains the current population;
comp_freq computes current frequency information;
freq contains current frequency information;
num for basic numeric parameters;
txt for current text settings;
pal for current color settings
Other visualization functions:
plot.riskyr(),
plot_area(),
plot_crisk(),
plot_curve(),
plot_fnet(),
plot_icons(),
plot_mosaic(),
plot_plane(),
plot_prism(),
plot_tab(),
plot_tree()
Examples
# Basics:
# (1) Using global prob and freq values:
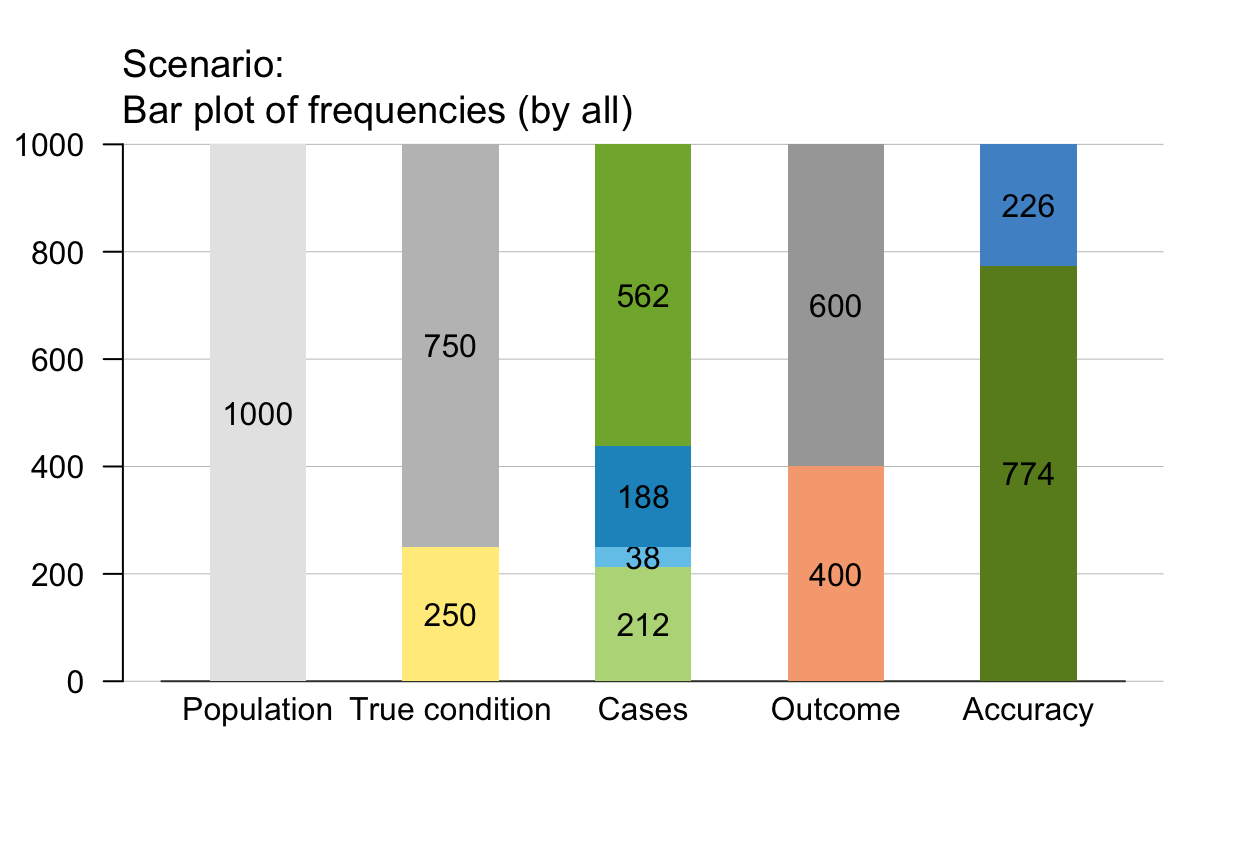
plot_bar()
 # (2) Providing values:
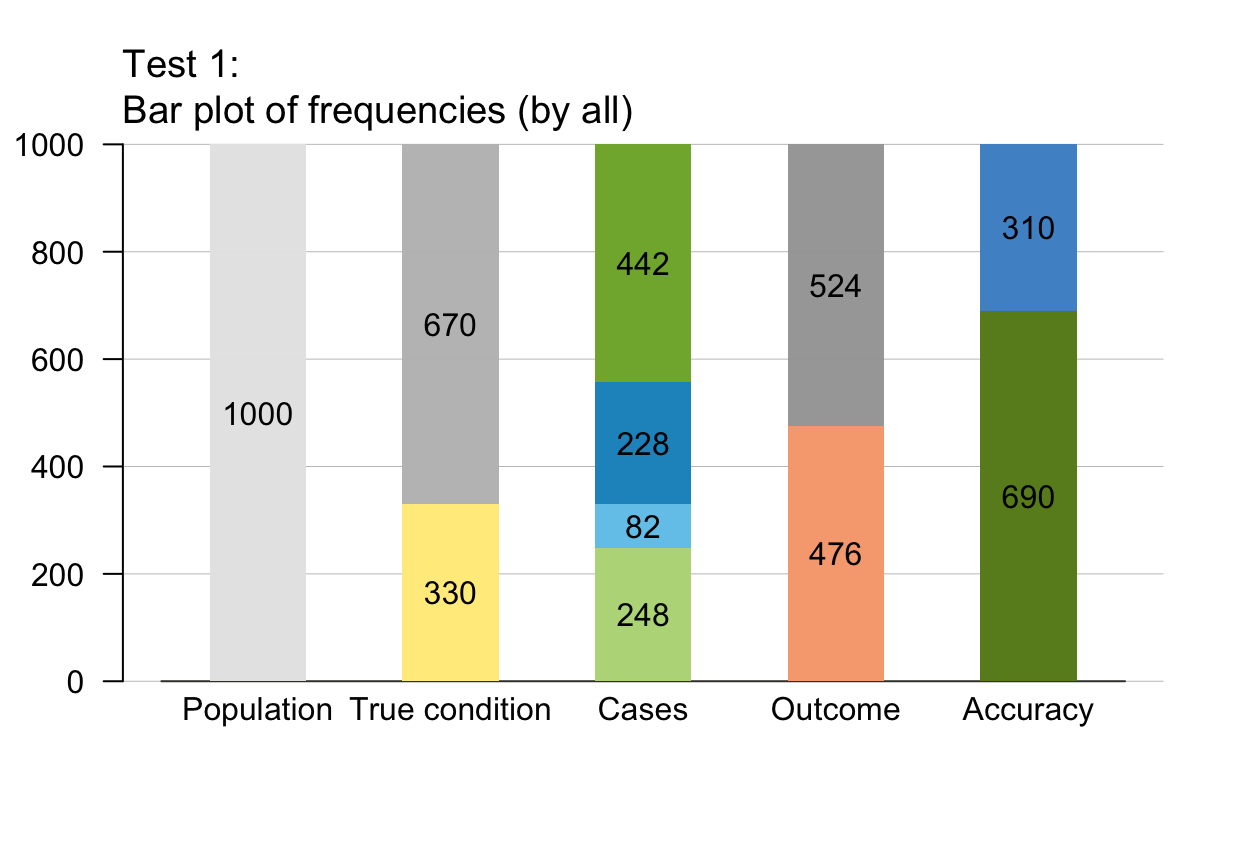
plot_bar(prev = .33, sens = .75, spec = .66, main = "Test 1")
# (2) Providing values:
plot_bar(prev = .33, sens = .75, spec = .66, main = "Test 1")
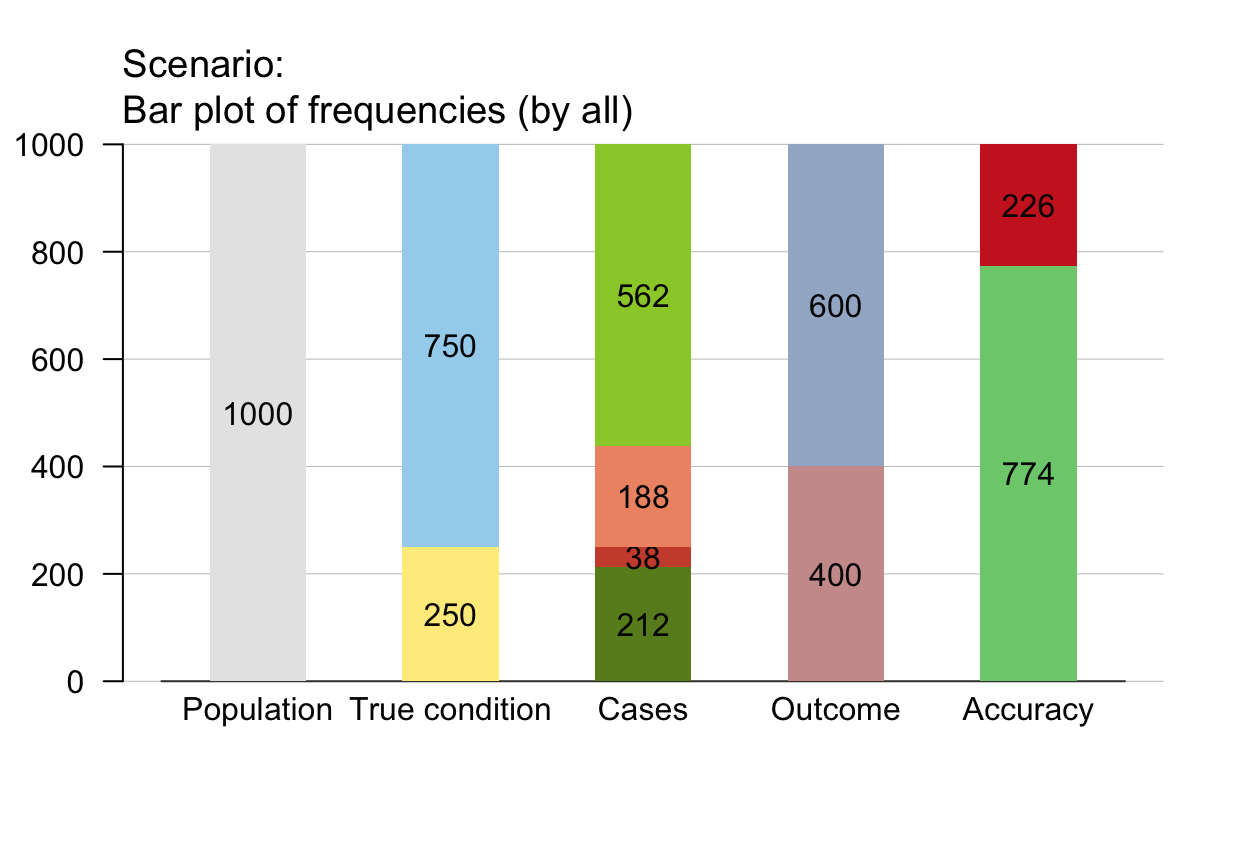
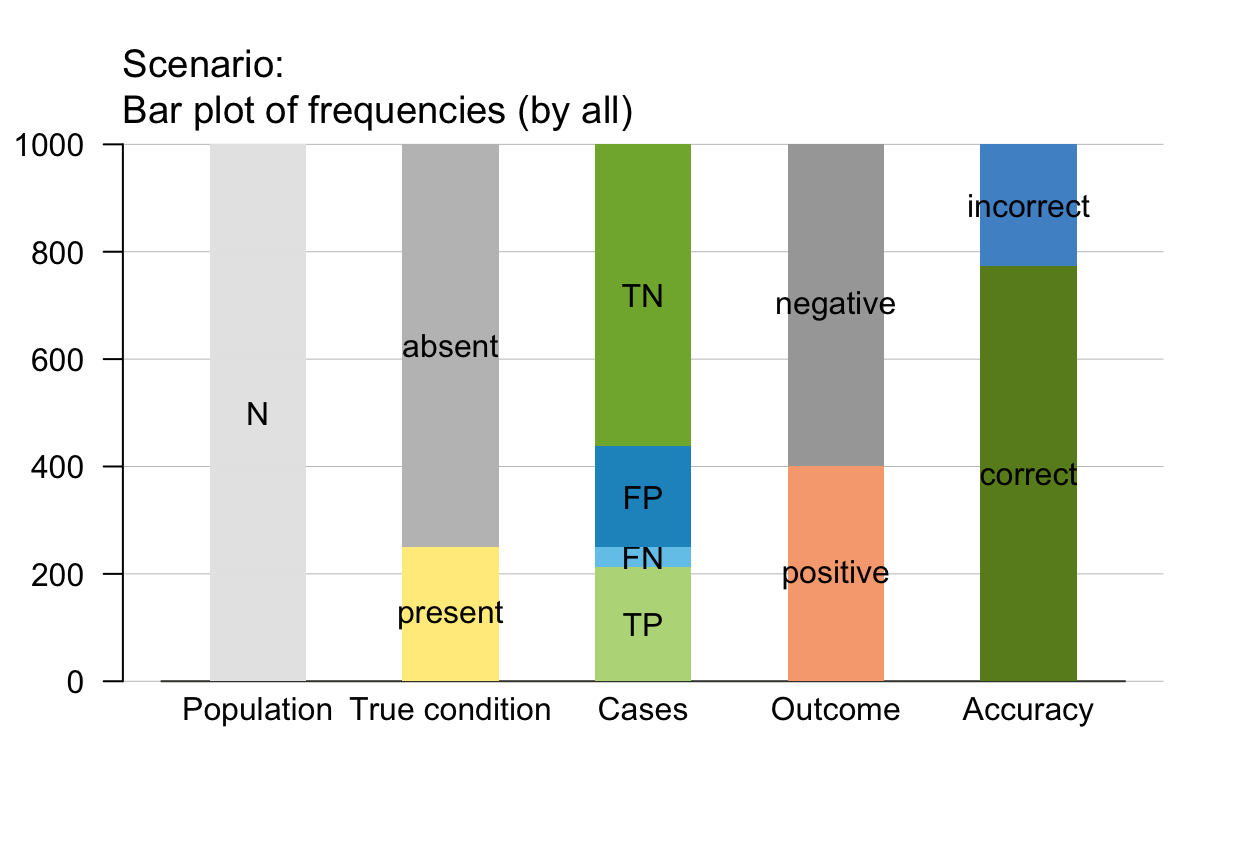
 plot_bar(N = 1000, prev = .33, sens = .75, spec = .60, main = "Test 2") # by "all" (default)
 # (3) Rounding and sampling:
plot_bar(N = 100, prev = 1/3, sens = 2/3, spec = 6/7, area = "hr", round = FALSE)
#> Warning: "area" is not a graphical parameter
#> Warning: "area" is not a graphical parameter
#> Warning: "area" is not a graphical parameter
#> Warning: "area" is not a graphical parameter
#> Warning: "area" is not a graphical parameter
#> Warning: "area" is not a graphical parameter
#> Warning: "area" is not a graphical parameter
#> Warning: "area" is not a graphical parameter
#> Warning: "area" is not a graphical parameter
#> Warning: "area" is not a graphical parameter
#> Warning: "area" is not a graphical parameter
#> Warning: "area" is not a graphical parameter
#> Warning: "area" is not a graphical parameter
#> Warning: "area" is not a graphical parameter
#> Warning: "area" is not a graphical parameter
#> Warning: "area" is not a graphical parameter
#> Warning: "area" is not a graphical parameter
#> Warning: "area" is not a graphical parameter
#> Warning: "area" is not a graphical parameter
#> Warning: "area" is not a graphical parameter
#> Warning: "area" is not a graphical parameter
#> Warning: "area" is not a graphical parameter
#> Warning: "area" is not a graphical parameter
#> Warning: "area" is not a graphical parameter
#> Warning: "area" is not a graphical parameter
#> Warning: "area" is not a graphical parameter
#> Warning: "area" is not a graphical parameter
# (3) Rounding and sampling:
plot_bar(N = 100, prev = 1/3, sens = 2/3, spec = 6/7, area = "hr", round = FALSE)
#> Warning: "area" is not a graphical parameter
#> Warning: "area" is not a graphical parameter
#> Warning: "area" is not a graphical parameter
#> Warning: "area" is not a graphical parameter
#> Warning: "area" is not a graphical parameter
#> Warning: "area" is not a graphical parameter
#> Warning: "area" is not a graphical parameter
#> Warning: "area" is not a graphical parameter
#> Warning: "area" is not a graphical parameter
#> Warning: "area" is not a graphical parameter
#> Warning: "area" is not a graphical parameter
#> Warning: "area" is not a graphical parameter
#> Warning: "area" is not a graphical parameter
#> Warning: "area" is not a graphical parameter
#> Warning: "area" is not a graphical parameter
#> Warning: "area" is not a graphical parameter
#> Warning: "area" is not a graphical parameter
#> Warning: "area" is not a graphical parameter
#> Warning: "area" is not a graphical parameter
#> Warning: "area" is not a graphical parameter
#> Warning: "area" is not a graphical parameter
#> Warning: "area" is not a graphical parameter
#> Warning: "area" is not a graphical parameter
#> Warning: "area" is not a graphical parameter
#> Warning: "area" is not a graphical parameter
#> Warning: "area" is not a graphical parameter
#> Warning: "area" is not a graphical parameter
 plot_bar(N = 100, prev = 1/3, sens = 2/3, spec = 6/7, area = "hr", sample = TRUE, scale = "freq")
#> Warning: "area" is not a graphical parameter
#> Warning: "area" is not a graphical parameter
#> Warning: "area" is not a graphical parameter
#> Warning: "area" is not a graphical parameter
#> Warning: "area" is not a graphical parameter
#> Warning: "area" is not a graphical parameter
#> Warning: "area" is not a graphical parameter
#> Warning: "area" is not a graphical parameter
#> Warning: "area" is not a graphical parameter
#> Warning: "area" is not a graphical parameter
#> Warning: "area" is not a graphical parameter
#> Warning: "area" is not a graphical parameter
#> Warning: "area" is not a graphical parameter
#> Warning: "area" is not a graphical parameter
#> Warning: "area" is not a graphical parameter
#> Warning: "area" is not a graphical parameter
#> Warning: "area" is not a graphical parameter
#> Warning: "area" is not a graphical parameter
#> Warning: "area" is not a graphical parameter
#> Warning: "area" is not a graphical parameter
#> Warning: "area" is not a graphical parameter
#> Warning: "area" is not a graphical parameter
#> Warning: "area" is not a graphical parameter
#> Warning: "area" is not a graphical parameter
#> Warning: "area" is not a graphical parameter
#> Warning: "area" is not a graphical parameter
#> Warning: "area" is not a graphical parameter
plot_bar(N = 100, prev = 1/3, sens = 2/3, spec = 6/7, area = "hr", sample = TRUE, scale = "freq")
#> Warning: "area" is not a graphical parameter
#> Warning: "area" is not a graphical parameter
#> Warning: "area" is not a graphical parameter
#> Warning: "area" is not a graphical parameter
#> Warning: "area" is not a graphical parameter
#> Warning: "area" is not a graphical parameter
#> Warning: "area" is not a graphical parameter
#> Warning: "area" is not a graphical parameter
#> Warning: "area" is not a graphical parameter
#> Warning: "area" is not a graphical parameter
#> Warning: "area" is not a graphical parameter
#> Warning: "area" is not a graphical parameter
#> Warning: "area" is not a graphical parameter
#> Warning: "area" is not a graphical parameter
#> Warning: "area" is not a graphical parameter
#> Warning: "area" is not a graphical parameter
#> Warning: "area" is not a graphical parameter
#> Warning: "area" is not a graphical parameter
#> Warning: "area" is not a graphical parameter
#> Warning: "area" is not a graphical parameter
#> Warning: "area" is not a graphical parameter
#> Warning: "area" is not a graphical parameter
#> Warning: "area" is not a graphical parameter
#> Warning: "area" is not a graphical parameter
#> Warning: "area" is not a graphical parameter
#> Warning: "area" is not a graphical parameter
#> Warning: "area" is not a graphical parameter
 # Perspectives (by):
# plot_bar(N = 1000, prev = .33, sens = .75, spec = .60, by = "cd",
# main = "Test 3a") # by condition
plot_bar(N = 1000, prev = .33, sens = .75, spec = .60, by = "cd", dir = 2,
main = "Test 3b", f_lbl = "num") # bi-directional
# Perspectives (by):
# plot_bar(N = 1000, prev = .33, sens = .75, spec = .60, by = "cd",
# main = "Test 3a") # by condition
plot_bar(N = 1000, prev = .33, sens = .75, spec = .60, by = "cd", dir = 2,
main = "Test 3b", f_lbl = "num") # bi-directional
 # plot_bar(N = 1000, prev = .33, sens = .75, spec = .60, by = "dc",
# main = "Test 4a") # by decision
plot_bar(N = 1000, prev = .33, sens = .75, spec = .60, by = "dc", dir = 2,
main = "Test 4b", f_lbl = "num") # bi-directional
# plot_bar(N = 1000, prev = .33, sens = .75, spec = .60, by = "dc",
# main = "Test 4a") # by decision
plot_bar(N = 1000, prev = .33, sens = .75, spec = .60, by = "dc", dir = 2,
main = "Test 4b", f_lbl = "num") # bi-directional
 # plot_bar(N = 1000, prev = .33, sens = .75, spec = .60, by = "ac",
# main = "Test 5a") # by accuracy
plot_bar(N = 1000, prev = .33, sens = .75, spec = .60, by = "ac", dir = 2,
main = "Test 5b", f_lbl = "num") # bi-directional
# plot_bar(N = 1000, prev = .33, sens = .75, spec = .60, by = "ac",
# main = "Test 5a") # by accuracy
plot_bar(N = 1000, prev = .33, sens = .75, spec = .60, by = "ac", dir = 2,
main = "Test 5b", f_lbl = "num") # bi-directional
 # Customize colors and text:
plot_bar(dir = 1, f_lbl = "num", col_pal = pal_org)
# Customize colors and text:
plot_bar(dir = 1, f_lbl = "num", col_pal = pal_org)
 # plot_bar(dir = 2, f_lbl = "nam", col_pal = pal_bw)
# Frequency labels (f_lbl):
# plot_bar(f_lbl = "def") # default labels: name = num
plot_bar(f_lbl = "nam") # name only
# plot_bar(dir = 2, f_lbl = "nam", col_pal = pal_bw)
# Frequency labels (f_lbl):
# plot_bar(f_lbl = "def") # default labels: name = num
plot_bar(f_lbl = "nam") # name only
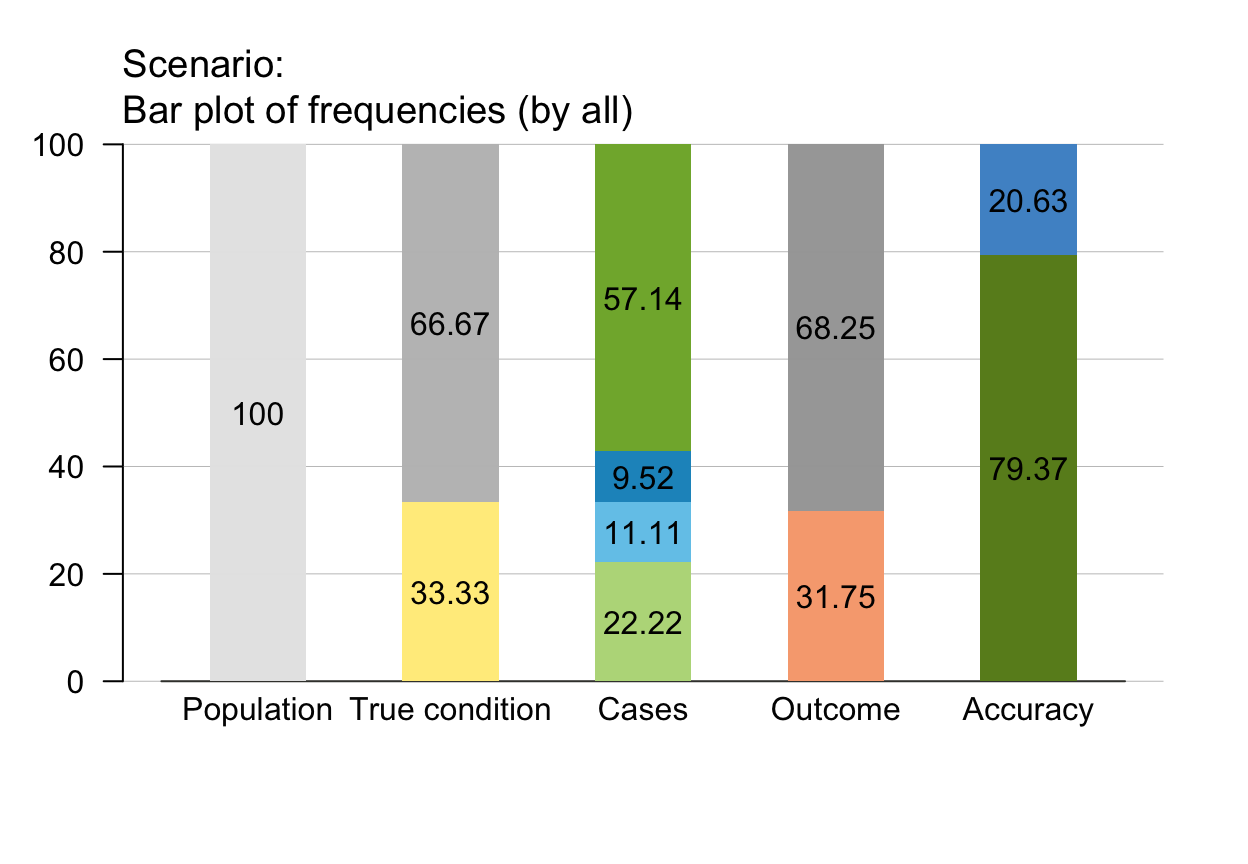
 plot_bar(f_lbl = "num") # numeric value only
 # plot_bar(f_lbl = "abb") # abbreviated name
# plot_bar(f_lbl = NA) # no labels (NA/NULL/"no")
# Scaling and rounding effects:
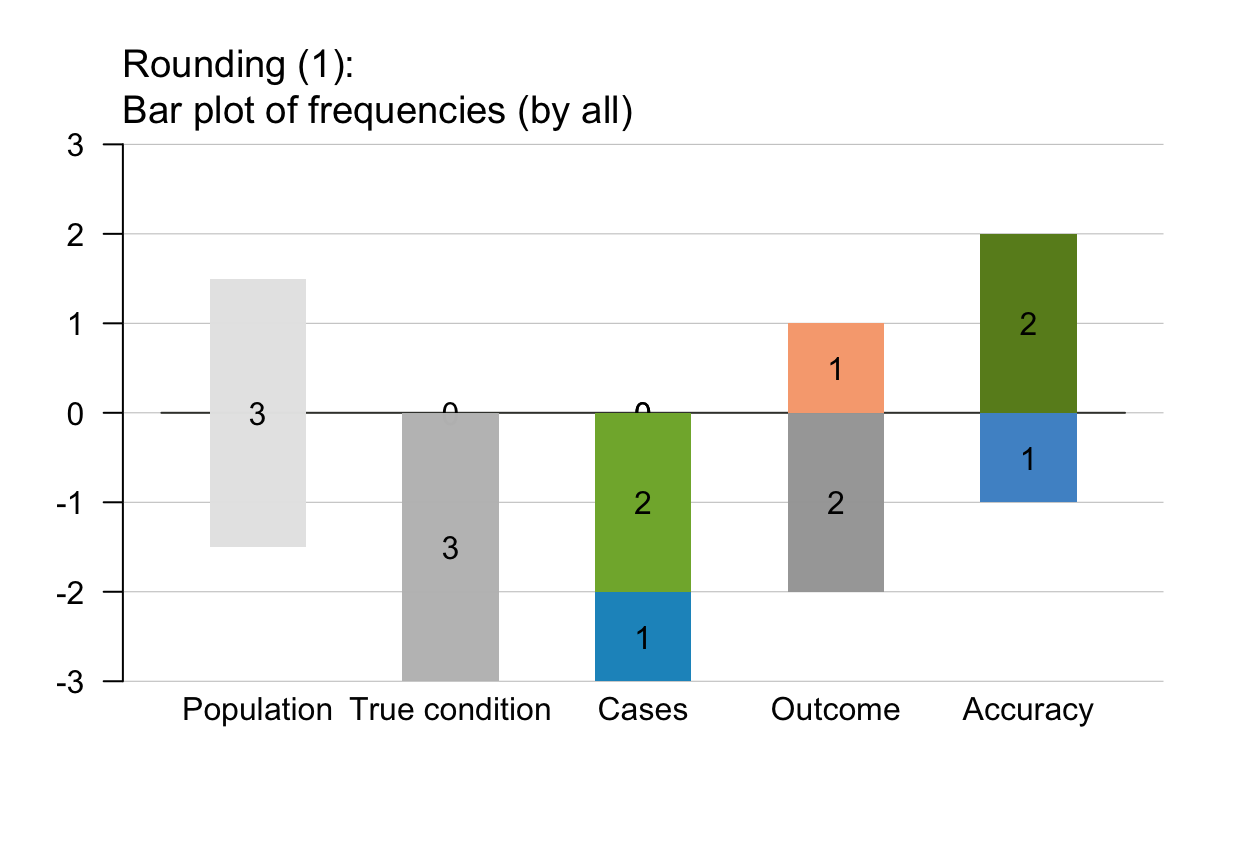
plot_bar(N = 3, prev = .1, sens = .7, spec = .6, dir = 2,
scale = "f", round = TRUE,
main = "Rounding (1)") # => Scale by freq and round freq.
# plot_bar(f_lbl = "abb") # abbreviated name
# plot_bar(f_lbl = NA) # no labels (NA/NULL/"no")
# Scaling and rounding effects:
plot_bar(N = 3, prev = .1, sens = .7, spec = .6, dir = 2,
scale = "f", round = TRUE,
main = "Rounding (1)") # => Scale by freq and round freq.
 plot_bar(N = 3, prev = .1, sens = .7, spec = .6, dir = 2,
scale = "p", round = TRUE,
main = "Rounding (2)") # => Scale by prob and round freq.
plot_bar(N = 3, prev = .1, sens = .7, spec = .6, dir = 2,
scale = "p", round = TRUE,
main = "Rounding (2)") # => Scale by prob and round freq.
 plot_bar(N = 3, prev = .1, sens = .7, spec = .6, dir = 2,
scale = "f", round = FALSE,
main = "Rounding (3)") # => Scale by freq and do NOT round freq.
plot_bar(N = 3, prev = .1, sens = .7, spec = .6, dir = 2,
scale = "f", round = FALSE,
main = "Rounding (3)") # => Scale by freq and do NOT round freq.
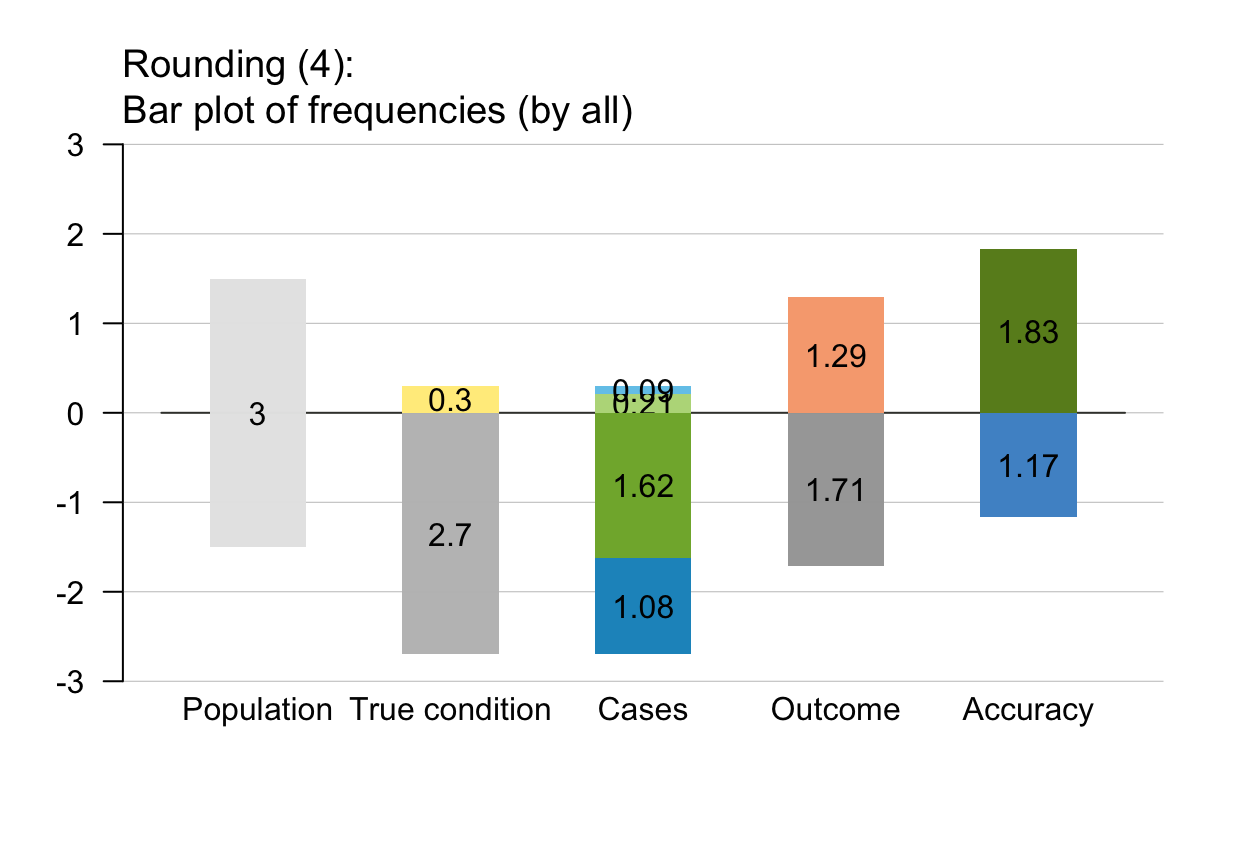
 plot_bar(N = 3, prev = .1, sens = .7, spec = .6, dir = 2,
scale = "p", round = FALSE,
main = "Rounding (4)") # => Scale by prob and do NOT round freq.
plot_bar(N = 3, prev = .1, sens = .7, spec = .6, dir = 2,
scale = "p", round = FALSE,
main = "Rounding (4)") # => Scale by prob and do NOT round freq.