heading plots 1 or more text strings (provided as a character vector labels)
as a heading to an (existing or new) plot and places a colored box behind
each label to mark it (i.e., highlighting the heading).
Usage
heading(
  labels,
  x = 0,
  y = 0.8,
  x_layout = NA,
  y_layout = "flush",
  col = "black",
  col_bg = "default",
  cex = 2,
  font = 2,
  new_plot = "slide"
)
Arguments
- labels
A character vector specifying the text labels to be plotted.
- x
A numeric vector of x-coordinates at which the text labels in
labelsshould be written. If the lengths ofxandydiffer, the shorter one is recycled. Default:x = 0.- y
A numeric vector of y-coordinates at which the text labels in
labelsshould be written. If the lengths ofxandydiffer, the shorter one is recycled. Default:y = .8.- x_layout
An optional numeric vector or character string to control the horizontal positions of
labels. Numeric values are interpreted as increments to values ofxand recycled (to enable stepwise or alternating patterns). 3 character string options are:"center"(i.e., center wrt. first label or plot center),"left"(i.e., left wrt. first label or plot center),"right"(i.e., right wrt. first label or plot center). Default:x_layout = NA(i.e., using values ofx).- y_layout
A numeric value or character string to control the vertical positions of
labels. Numeric values are interpreted as increments to values ofy[1]and recycled (to enable stepwise or alternating patterns). 2 character string options are:"even"(i.e., even distribution of labels across available y-space) and"flush"(i.e., no space between adjacent labels, i.e.,y_layout = 0). Default:y_layout = "flush".- col
The color(s) of the text label(s). Default:
col_lbl = "black".- col_bg
The color(s) to highlight or fill the rectangle(s) with. Default:
col_bg = "default"(to automatically select different shades ofpal_seeblau).- cex
Numeric character expansion factor(s), multiplied by
par("cex")to yield the character size(s). Default:cex = 2.- font
The font type(s) to be used. Default:
font = 2(i.e., bold).- new_plot
Boolean: Should a new plot be generated? Set to
"blank"or"slide"to create a new plot, and to"none"to add to an existing plot. Default:new_plot = "slide"(i.e., create a newslide).
Details
Text formatting parameters (like col, col_bg, cex, font)
are recycled to match length(labels).
heading uses the base graphics system graphics::.
Examples
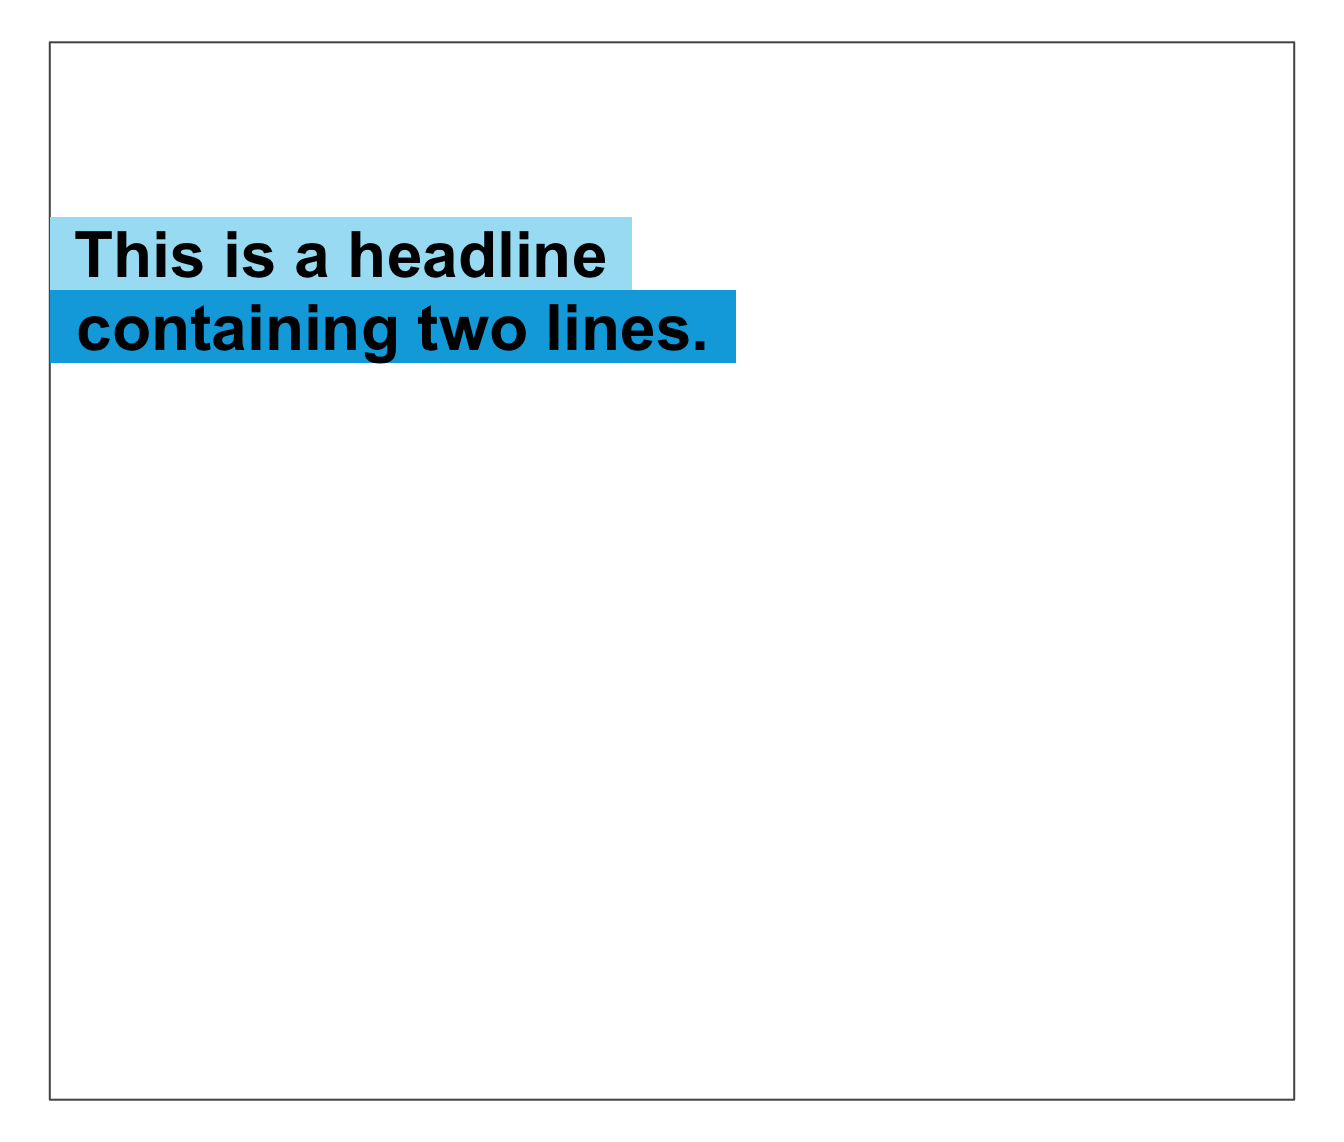
heading(labels = c("This is a headline", "containing two lines."))
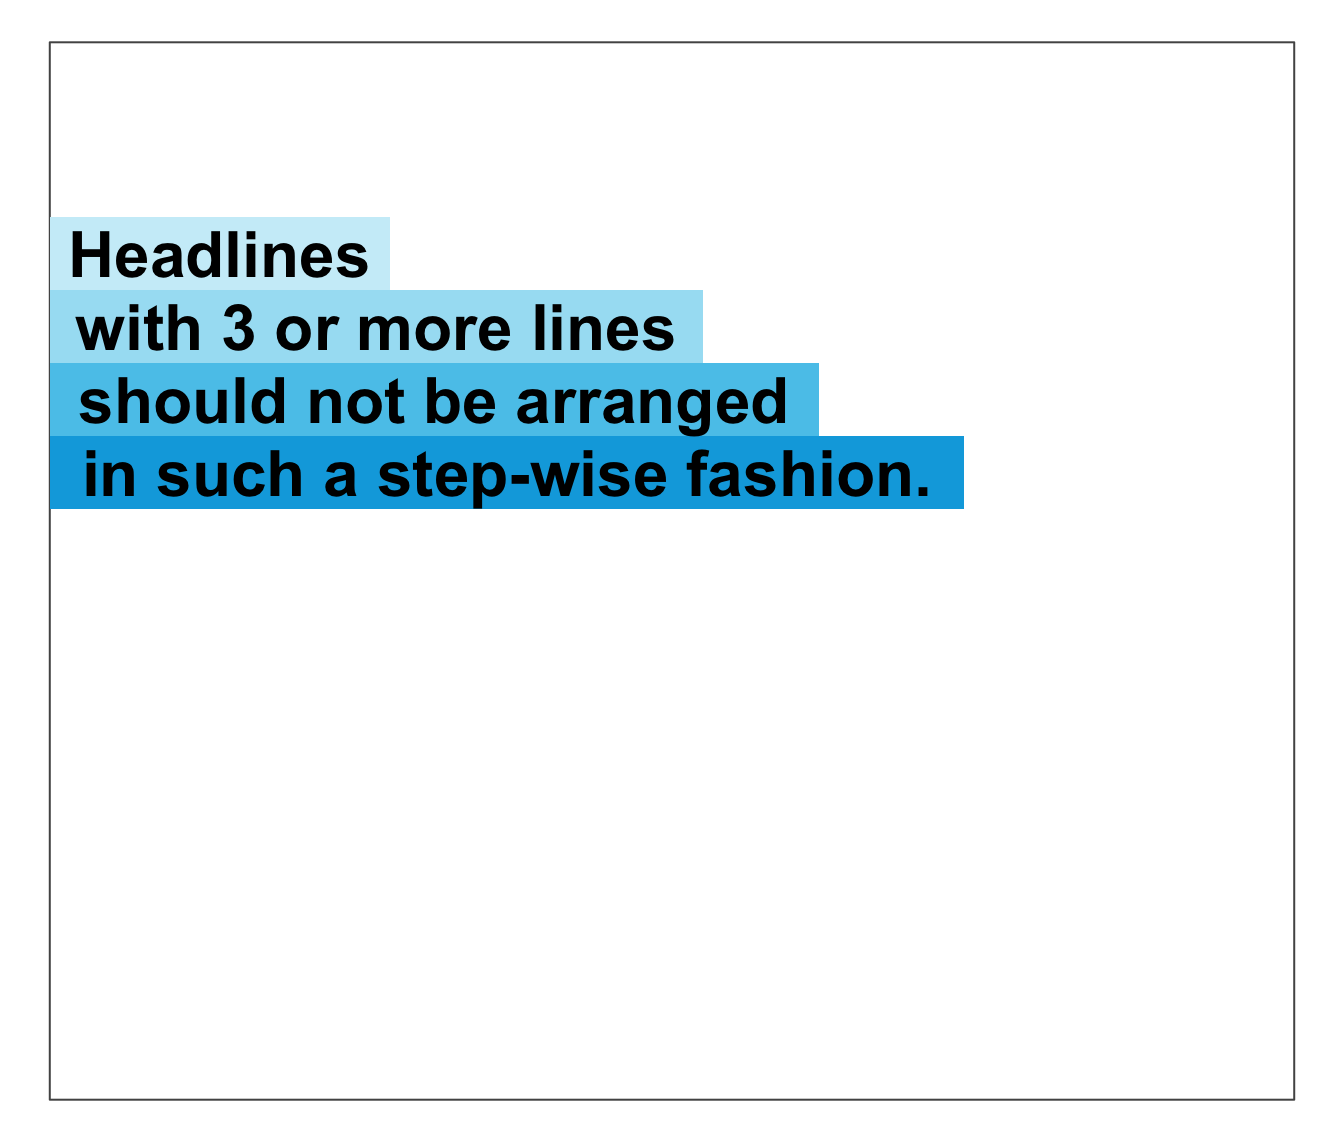
 # Note the warning:
heading(labels = c("Headlines", "with 3 or more lines",
"should not be arranged", "in such a step-wise fashion."))
#> Step-wise titles are discouraged: Consider re-arranging?
# Note the warning:
heading(labels = c("Headlines", "with 3 or more lines",
"should not be arranged", "in such a step-wise fashion."))
#> Step-wise titles are discouraged: Consider re-arranging?
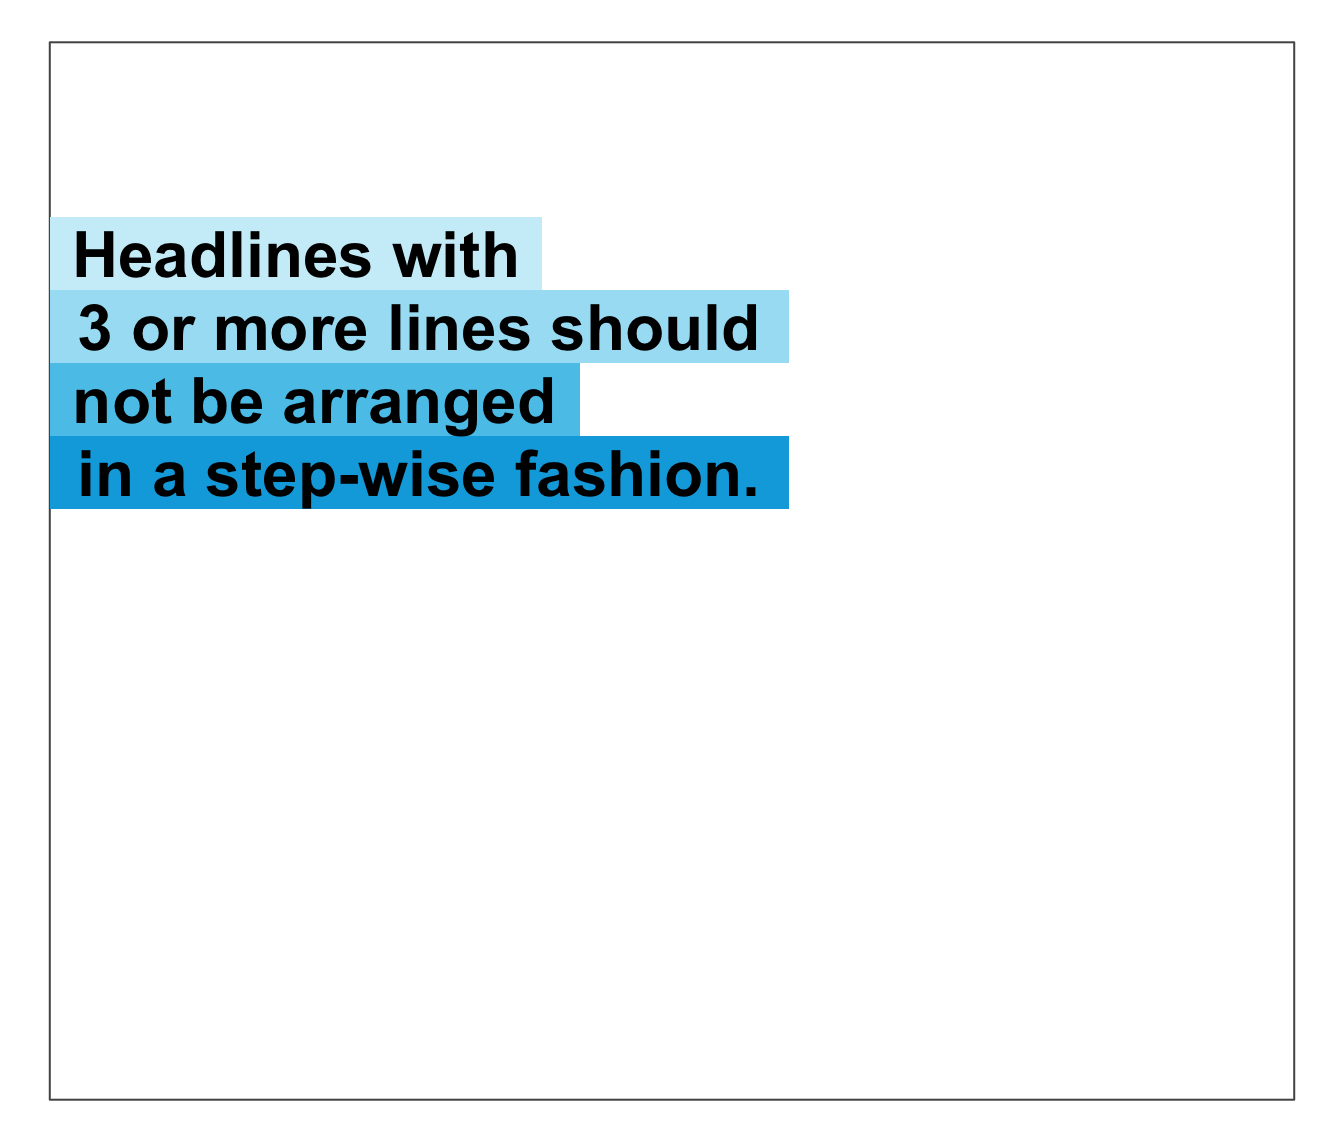
 # Avoiding the warning:
heading(labels = c("Headlines with", "3 or more lines should",
"not be arranged", "in a step-wise fashion."))
# Avoiding the warning:
heading(labels = c("Headlines with", "3 or more lines should",
"not be arranged", "in a step-wise fashion."))
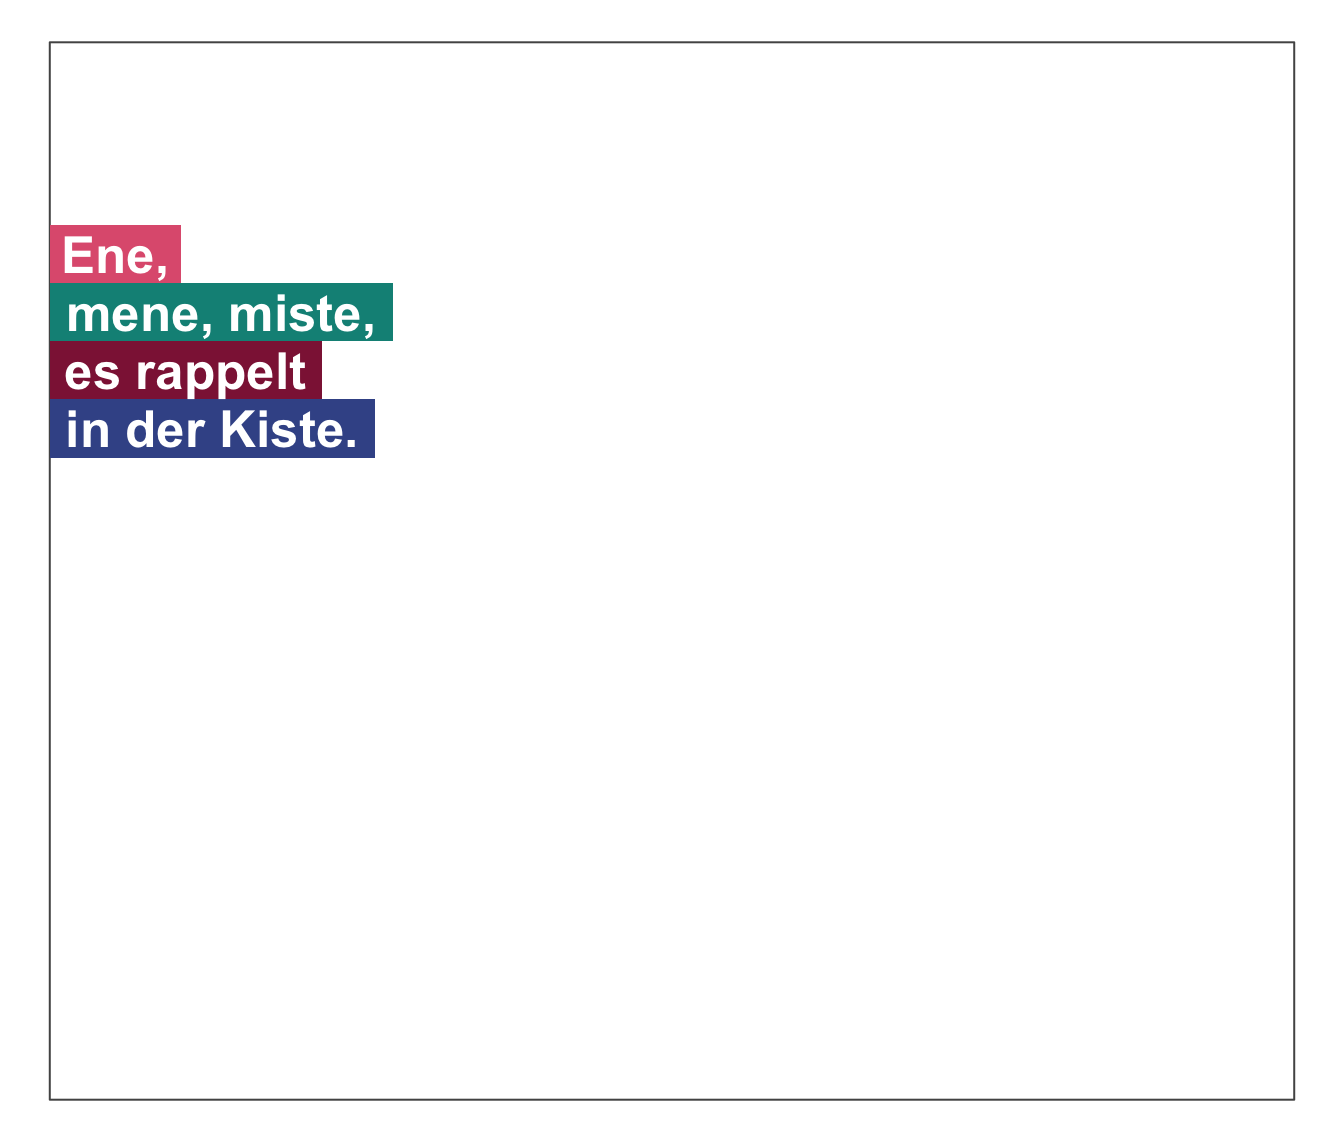
 # Using non-default colors:
heading(labels = c("Ene,", "mene, miste,", "es rappelt", "in der Kiste."),
cex = 1.6, col = "white", col_bg = usecol(c(Pinky, Seegruen, Bordeaux, Karpfenblau)))
# Using non-default colors:
heading(labels = c("Ene,", "mene, miste,", "es rappelt", "in der Kiste."),
cex = 1.6, col = "white", col_bg = usecol(c(Pinky, Seegruen, Bordeaux, Karpfenblau)))
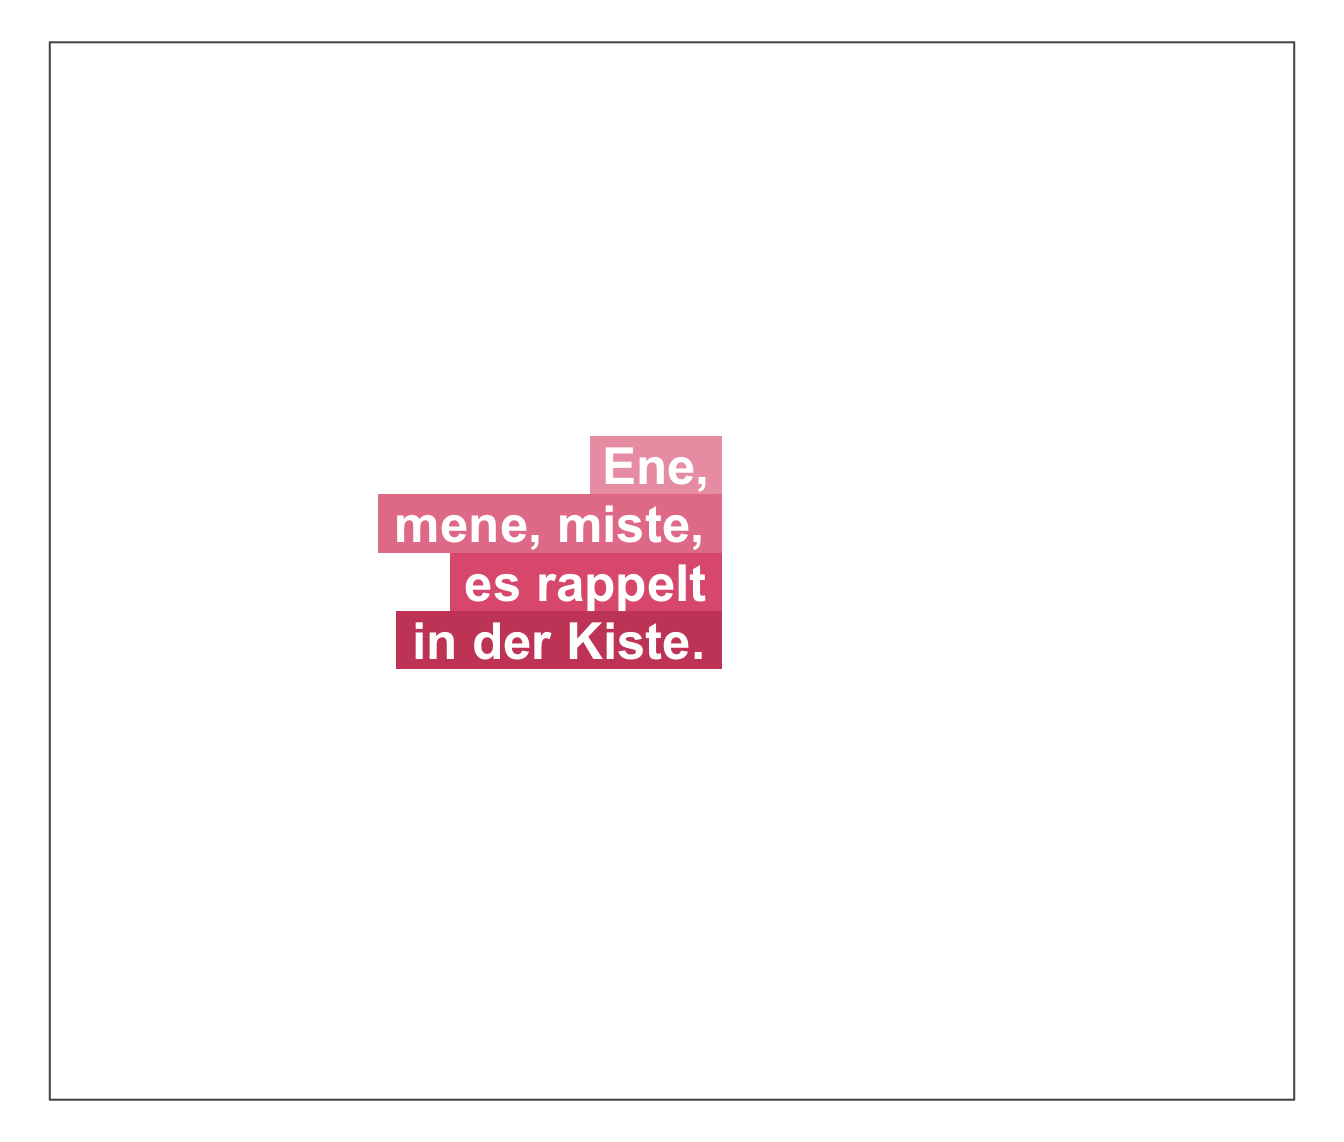
 # Using x_layout and y_layout:
heading(labels = c("Ene,", "mene, miste,", "es rappelt", "in der Kiste."),
cex = 1.6, col = "white", col_bg = usecol(pal_pinky[2:5]),
x = NA, y = .6, x_layout = "right", y_layout = "flush")
# Using x_layout and y_layout:
heading(labels = c("Ene,", "mene, miste,", "es rappelt", "in der Kiste."),
cex = 1.6, col = "white", col_bg = usecol(pal_pinky[2:5]),
x = NA, y = .6, x_layout = "right", y_layout = "flush")
 #' @family text functions