Colors and color functions
SPDS, uni.kn
2023 07 28
Source:vignettes/color_functions.Rmd
color_functions.Rmd

This vignette explains the colors, color palettes, and color-related functions provided by the unikn package. (See the vignettes on color recipes and institutional colors for more specialized tasks and the vignette on text for information on text boxes and decorations.)
Please install and/or load the unikn package to get started:
Overview
The unikn package provides some colors (e.g.,
Seeblau) and color palettes (e.g., pal_unikn).
However, its functionality is mainly based on color-related functions
that are useful beyond the colors and palettes of this package.
The package provides two main functions for interacting with color
palettes: seecol() and usecol().
-
seecol()is a general-purpose tool for seeing (inspecting or visualizing) colors or color palettes. Theseecol()function takes two main arguments:-
palprovides either one or multiple color palettes (with a default ofpal = "unikn_all");
-
nspecifies the number of desired colors (with a default ofn = "all").
-
Based on the input of pal, the seecol()
function distinguishes between two modes:
- A. viewing the details of a single color palette (when providing only one color palette);
- B. comparing multiple color palettes (when providing a
keyword or
list-object).
-
usecol()allows using colors or color palettes (e.g., when creating visualizations) without showing its details. Theusecol()function also takes arguments for conveniently manipulating color palettes:-
palprovides either one or multiple color palettes (with a default ofpal = pal_unikn);
-
nspecifies the number of desired colors (with a default ofn = "all"); -
alphaadjusts the opacity of all colors inpal(e.g.,alpha = .50for medium transparency).
-
Two additional functions allow finding colors by similarity or name:
simcol()allows finding similar colors (given a target color, a set of candidate colors, and some tolerance threshold(s));grepal()allows finding colors with particular names (i.e., colors whose names match somepatternor regular expression);
Finally, some auxiliary functions support specific color functions:
ac()adjusts color transparency;shades_of()allows creating linear color gradients;newpal()allows defining new color palettes (as vectors or data frames with dedicated color names); anddemopal()allows illustrating color palettes for different types of visualizations.
The rest of this vignette provides examples of and some details on using these functions. (See the Color recipes vignette for more examples of solving color-related tasks.)
Viewing colors and color palettes with seecol()
The behavior of the seecol() function distinguishes
between two modes and depends on the input to its initial
pal argument. It either shows (A) the details of an
individual color palette, or (B) allows comparing multiple color
palettes. The next two sections will address both modes in turn.
A. Viewing details of a single color palette
When the pal argument of the seecol()
function specifies a single color palette, the function plots a
more detailed view of this particular color palette:
seecol(pal_unikn) # view details of pal_unikn 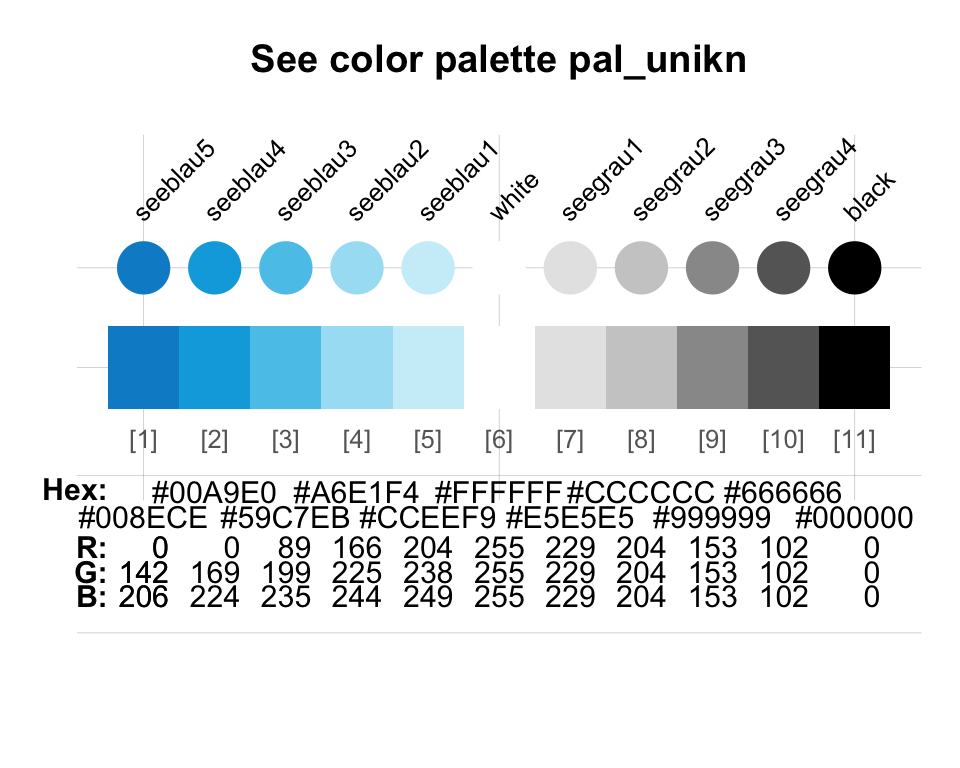
The detailed overview of a color palette provides us with
- the color names (where available),
- their numeric indices (within the color palette),
- the HEX values for each color,
- the RGB values for each color.
When a color palette contains too many colors, the HEX and RGB values
are no longer printed. However, setting hex and
rgb to TRUE will force them to be shown.
Note that seecol() also returns the color palette that
is being shown. Thus, a typical workflow comprises both seeing
a particular color palette and saving it (for storing and
applying it later):
my_pal <- seecol(pal_unikn_light) # view details of AND save a color palette 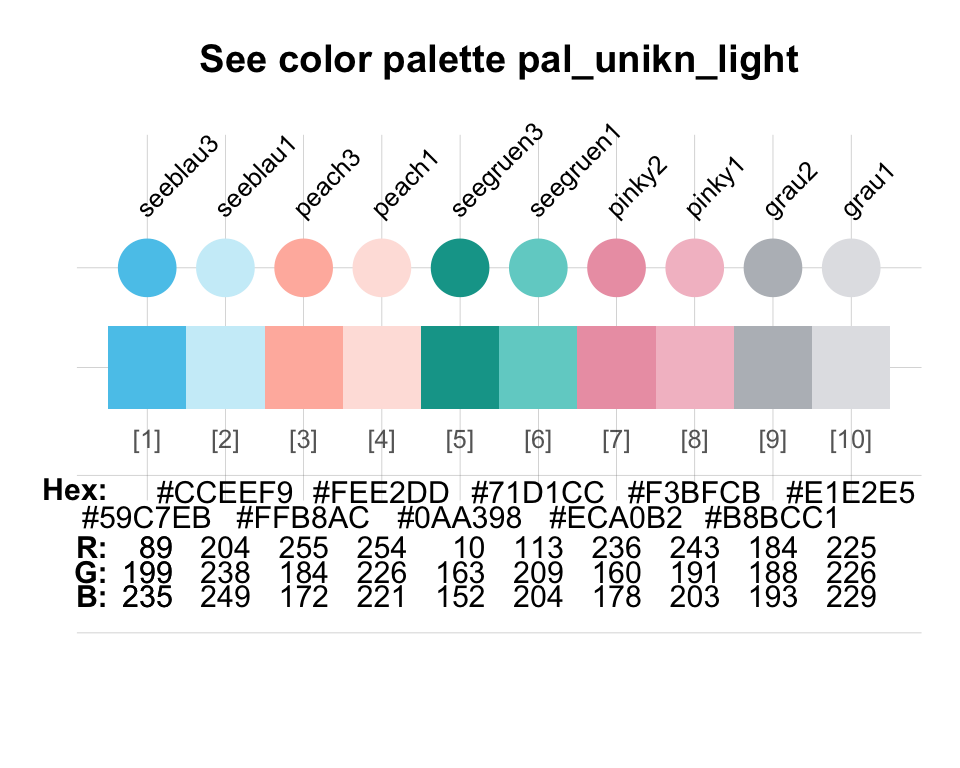
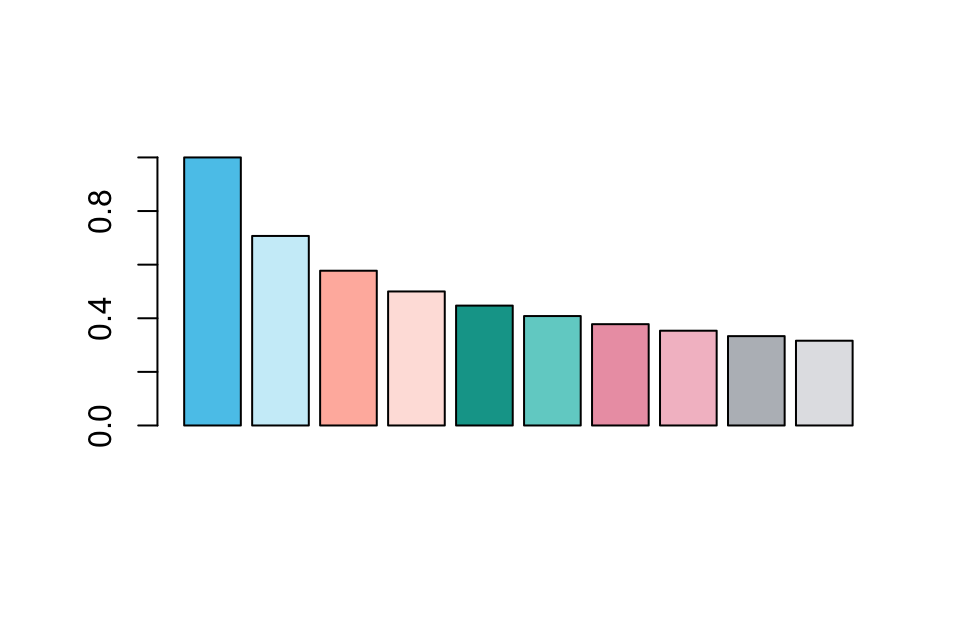
Due to saving the color palette (here to my_pal) we can
later use it in a visualization:
Note that seecol() invisibly returns the color
palette.
Thus, the following will plot the palette pal_bordeaux
without doing anything else with it:
seecol(pal_bordeaux)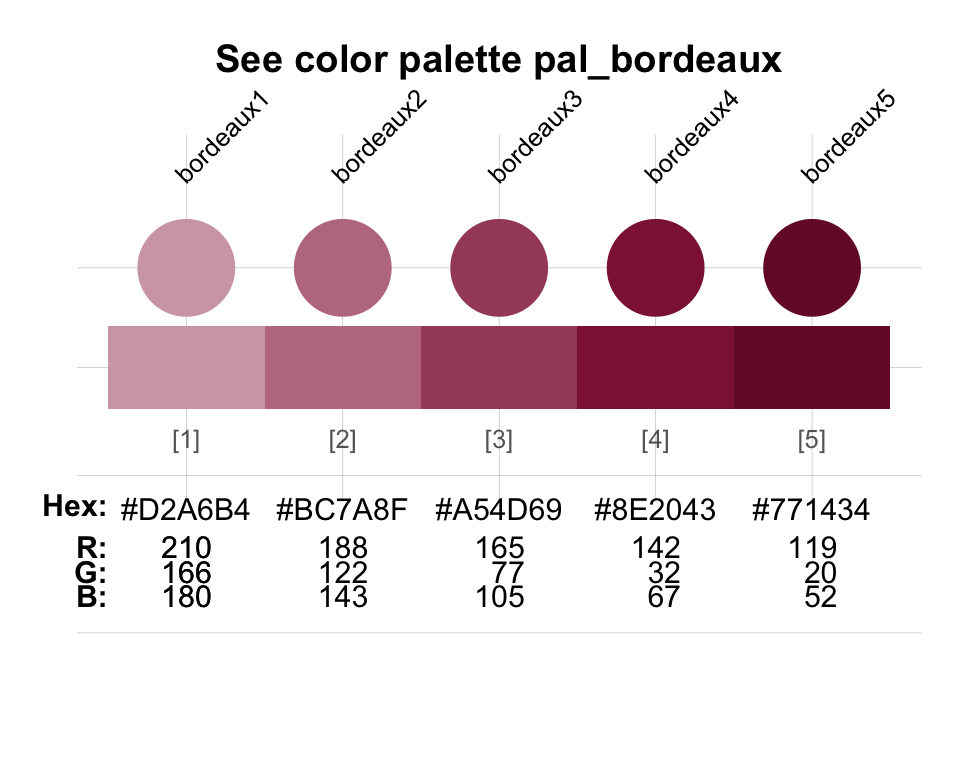
but the following would both plot and assign the palette to
my_pal:
my_pal <- seecol(pal_bordeaux)B. Viewing and comparing multiple color palettes
The second mode of seecol() is invoked by providing (a
list of) multiple color palettes to its pal
argument.
In this case, the function allows comparing these palettes by plotting a
color vector for each palette. Some special keywords within the
unikn package denote sets of color palettes:
- The keywords
"unikn_all","unikn_basic",pair_all","pref_all"and"grad_all"refer to University of Konstanz color palettes.
Calling seecol with pal set to these
keywords allows comparing pre-defined sets of the color palettes:
Viewing the uni.kn color palettes:
seecol("unikn_all") # all uni.kn color palettes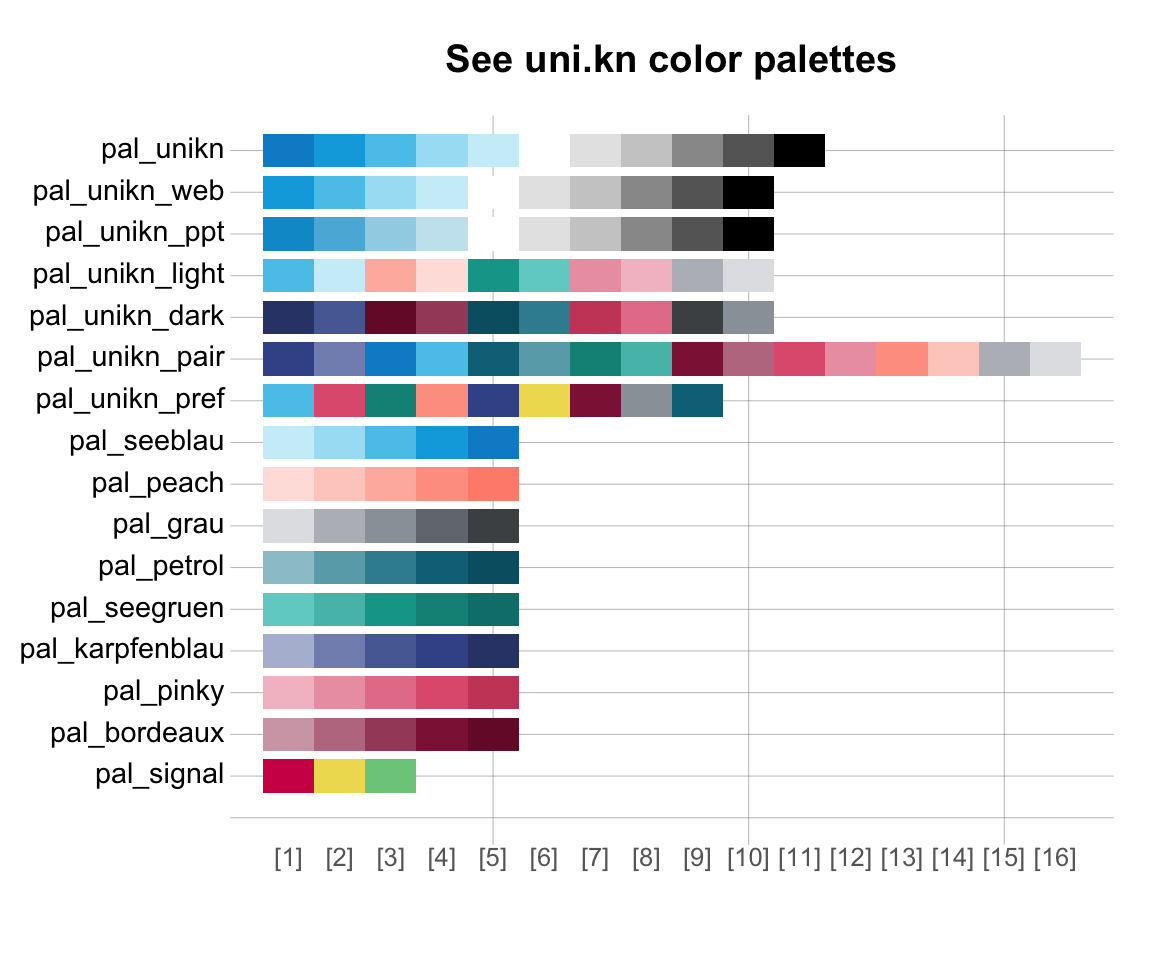
- three basic color palettes:
seecol("unikn_basic")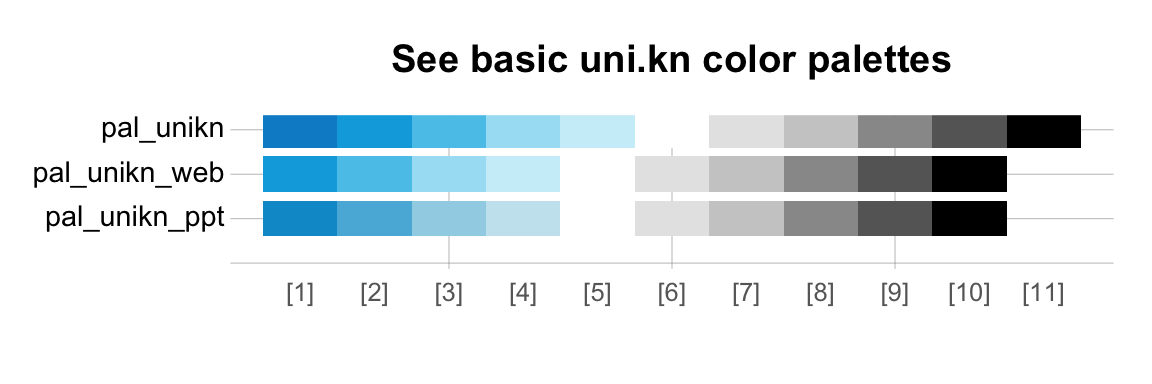
Note, that pal_unikn_web and pal_unikn_ppt
are almost identical, but differ in how vibrant their colors are.
- three paired color palettes:
seecol("pair_all")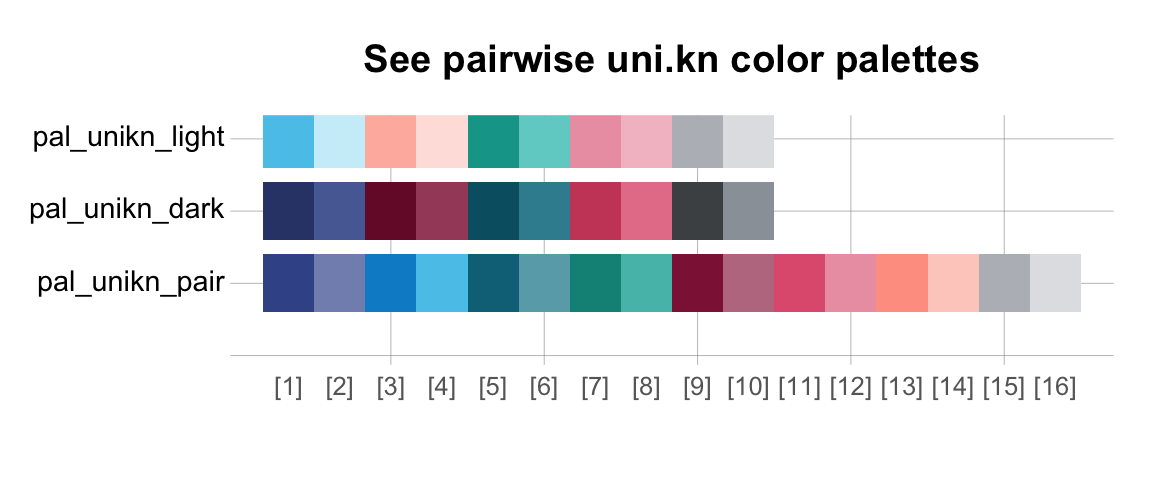
- all preferred colors from the spectrum and their respective gradients:
seecol("pref_all")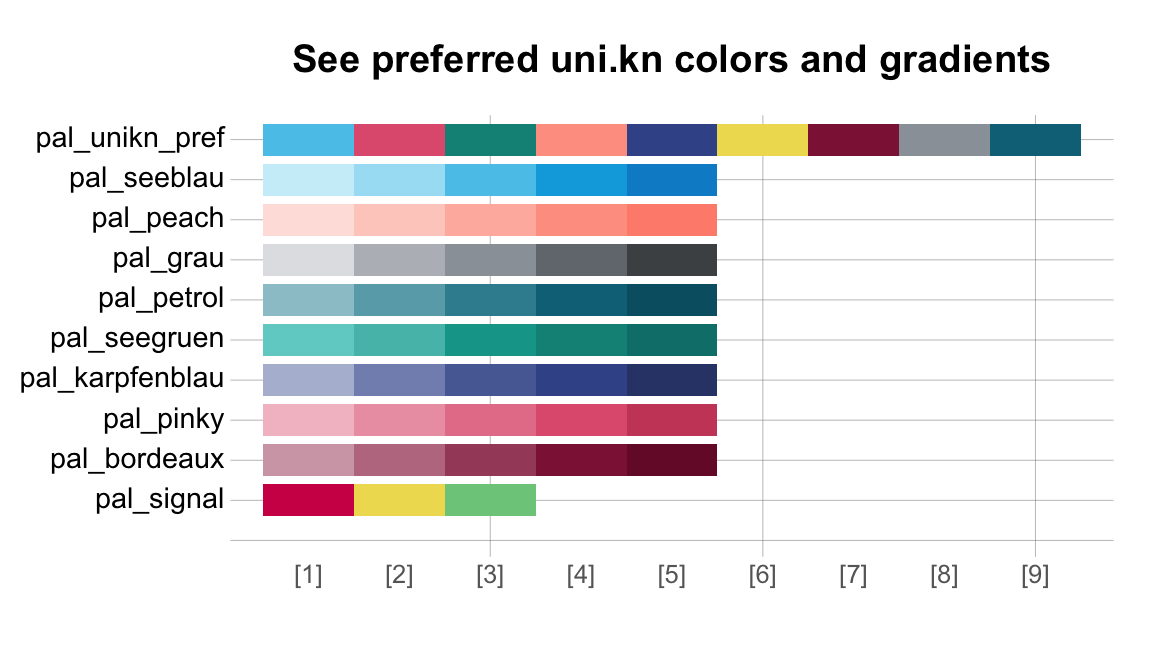
- only the pre-defined color gradients:
seecol("grad_all")
See the vignette on Institutional colors for creating color palettes for other institutions.
Other seecol() arguments
The seecol() function provides some aesthetic parameters
for adjusting how color palettes are plotted:
-
col_brdallows specifying the color of box borders (if shown. Default:col_brd = NULL);
-
lwd_brdallows specifying the line width of box borders (if shown. Default:lwd_brd = NULL);
-
mainandsuballow replacing the default titles with custom titles.
Examples:
seecol("grad_all", col_brd = "black", lwd_brd = .5, main = "Color gradients (with black borders)")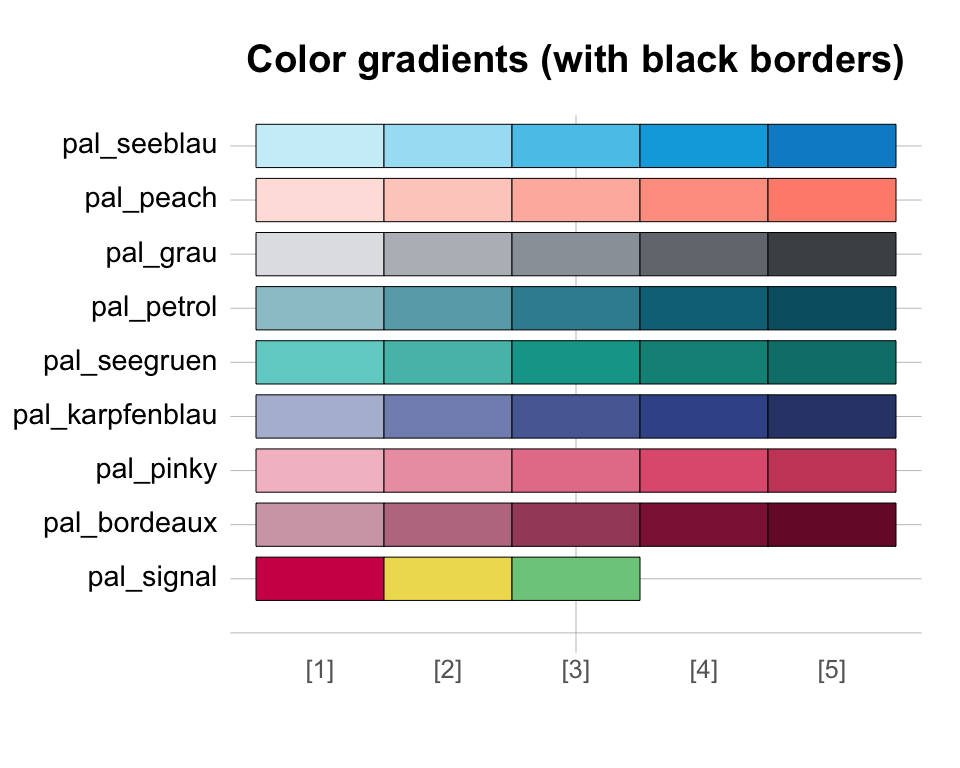
seecol(pal_seegruen, col_brd = "white", lwd_brd = 5, main = "A color palette (with white borders)")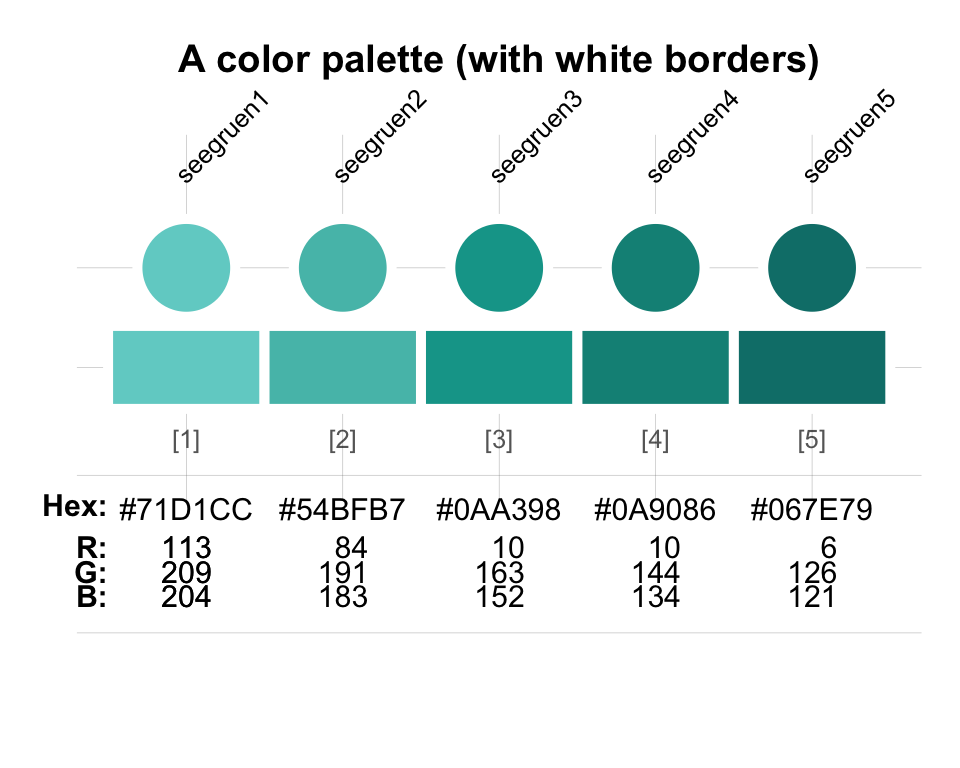
Using a color palette with usecol()
The usecol() function allows directly using a color
palette in a plot (i.e., without first viewing it).
usecol() corresponds to seecol() by taking the
same main arguments (pal and n). However, as
its purpose is using the colors specified by pal,
rather than plotting (or seeing) them, its
pal argument typically contains only one color palette:

Note that the seecol() and usecol()
functions are both quite permissive with respect to specifying their
pal argument: A particular color palette (e.g.,
pal_seegruen) can not only be displayed by providing it (as
an object) but also by providing its name (i.e.,
"pal_seegruen") or even an incomplete object name or name
(i.e., "seegruen" or seegruen). Hence, the
following expressions all yield the same result:
Customizing color palettes
Both the seecol() and the usecol()
functions allow a flexible on-the-fly customization of color
palettes.
Specifying a value for the n argument of
seecol() an usecol() allows:
- specifying subsets of colors and comparing these subsets for
different palettes for
nsmaller than the length of the color palette;
- extending color palettes and comparing different palettes for
ngreater than the length of the color palette.
Passing a vector of colors and/or color palettes allows users to create and view their own color palettes.
Finally, specifying a value for alpha (in a range from 0
to 1) allows controlling the transparency of the color palette(s), with
higher values for alpha corresponding to higher
transparency (i.e., lower opacity).
Selecting subsets
Using only a subset of colors:
seecol("unikn_all", n = 4)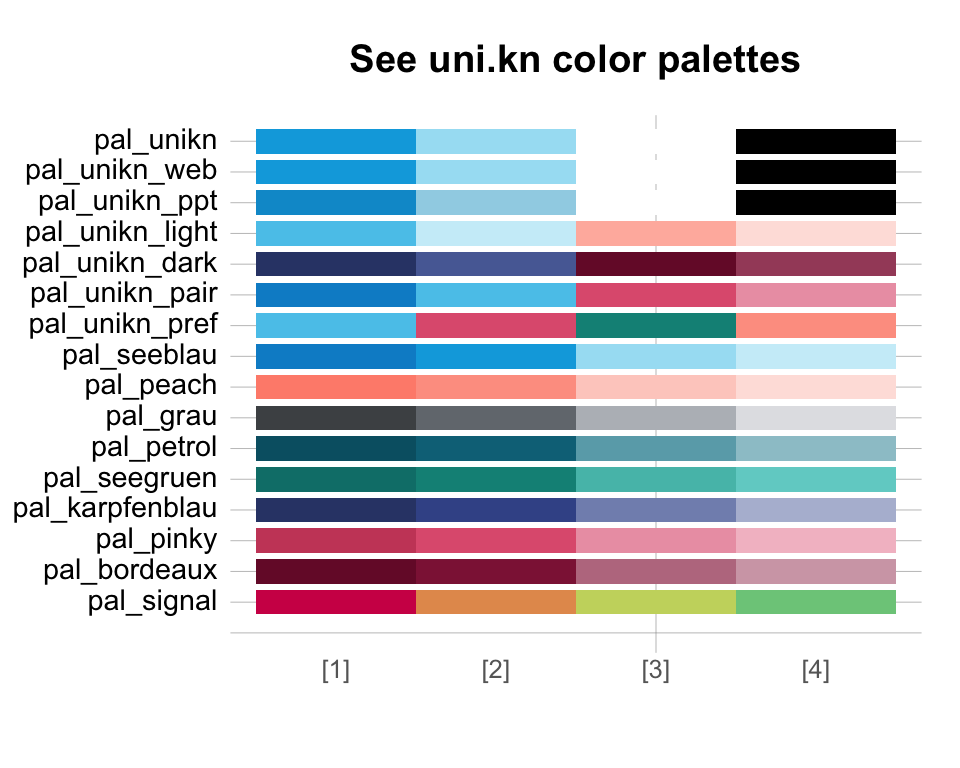
seecol(pal_unikn, 4)
Importantly, when using pre-defined color palettes of
unikn but a value of n that is smaller
than the length of the current color palette, usecol and
seecol select a predefined subset of colors:
barplot(1/sqrt(1:2), col = usecol(pal_seeblau, n = 2))
barplot(1/sqrt(1:3), col = usecol(pal_seeblau, n = 3))

Extending color palettes
For values of n that are larger than the number of
available colors in pal, the specified color palette is
extended using ColorRampPalette:
seecol("unikn_all", n = 12)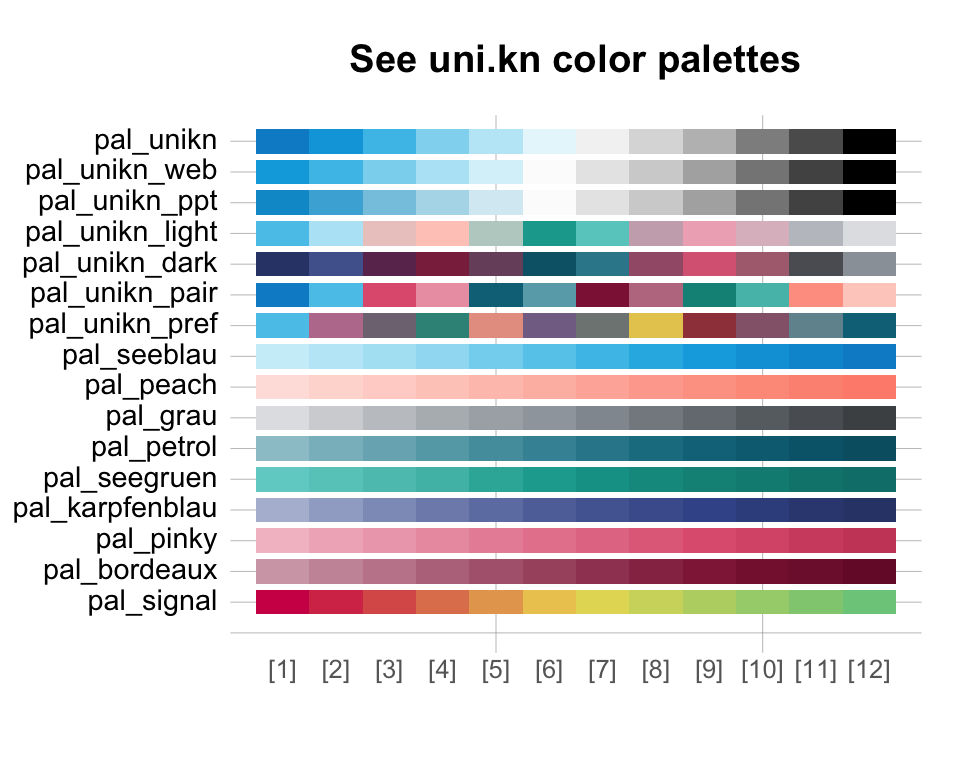
Both seecol() and usecol() allow extending
or truncating color palettes to a desired number n of
colors. For instance:
- Inspecting an extended version of
pal_seeblau(withn = 8colors):
seecol(pal_seeblau, n = 8)- Using a truncated version of
pal_bordeaux(withn = 3colors):
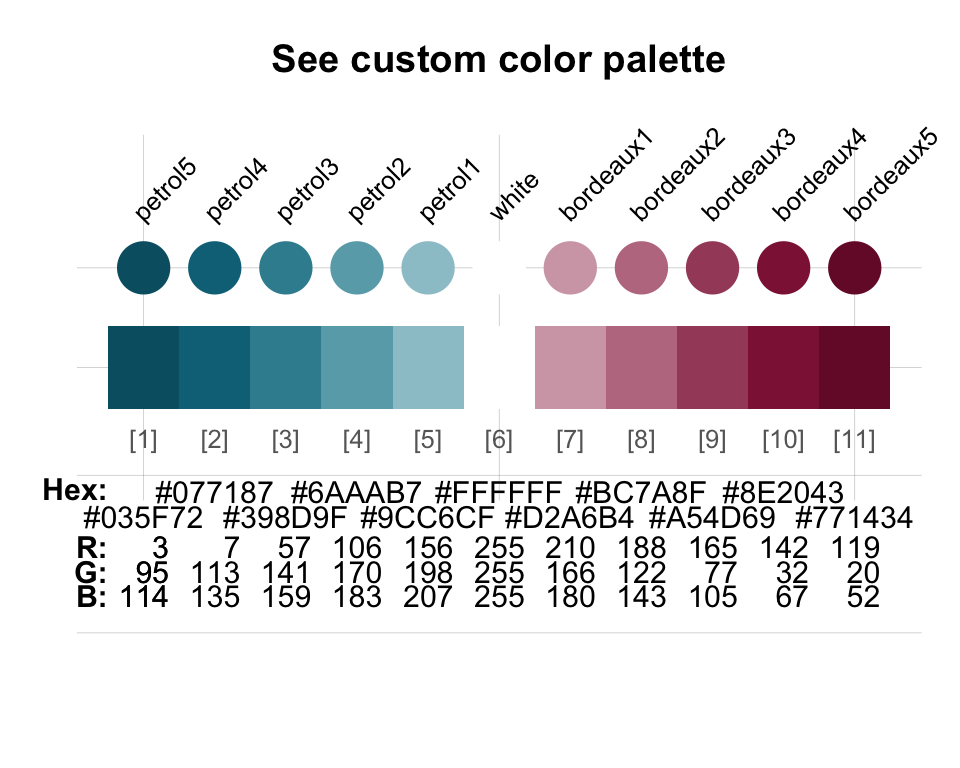
Mixing colors and color palettes
By passing a vector to pal, we can concatenate 2 color
palettes and connect them with a color (here: "white") as
the midpoint of a new color palette:
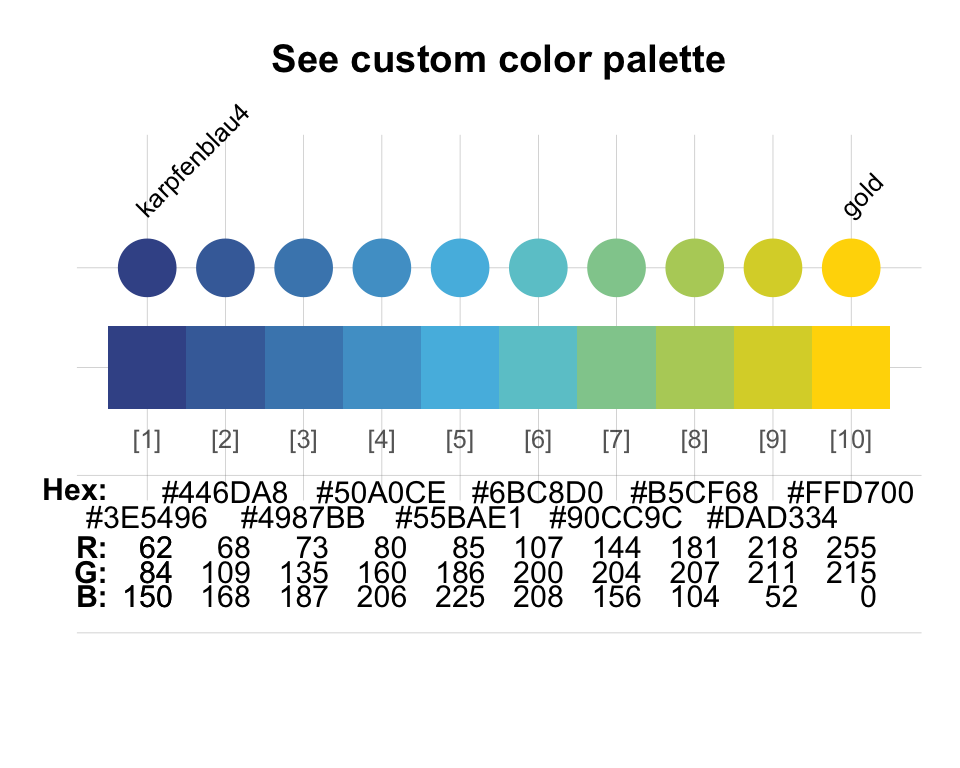
We can combine a set of colors and extend this palette by specifying
an n argument that is larger than the length of the
specified palette:
These custom palettes can easily be used in a plot. For instance, we
can define and use a subset of the pal_unikn_pair palette
as follows:
my_pair <- seecol(pal_unikn_pair, n = 10)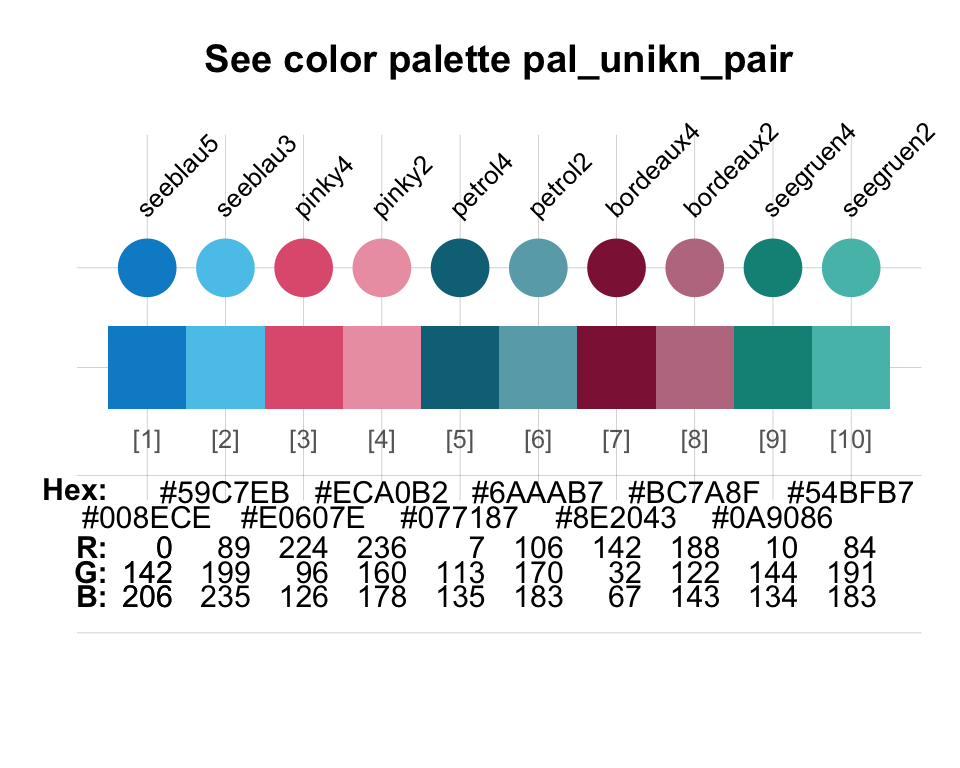
# Create data:
dat <- matrix(sample(5:10, size = 10, replace = TRUE), ncol = 5)

# Plot in my_pair colors:
barplot(dat, beside = TRUE, col = my_pair)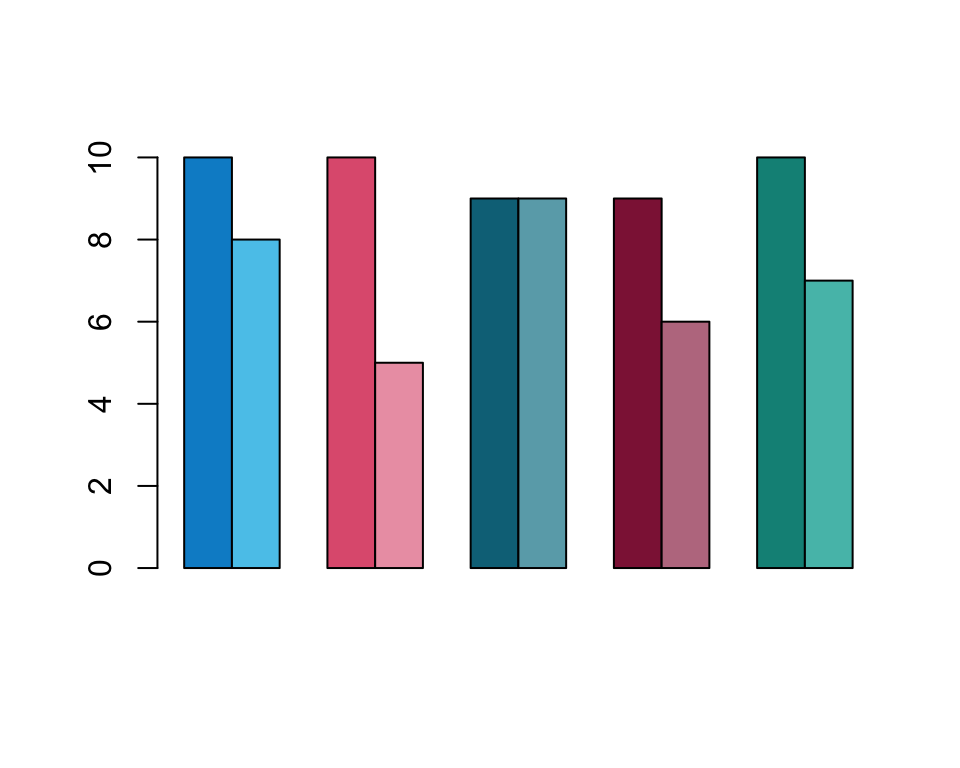
Creating linear color gradients is also supported by the
shades_of() function (see below).
Controlling transparency
Both seecol() and usecol() accept an
alpha argument (in a range from 0 to 1) for controlling the
transparency of color palettes, with higher values for
alpha corresponding to lower transparency (i.e., higher
opacity).
Displaying a specific color palette at a medium opacity/transparency:
seecol(pal_unikn, alpha = 0.5)![]()
Setting opacity for a custom color palette:
four_cols <- usecol(c("steelblue", "gold", "firebrick", "forestgreen"), alpha = 2/3)

seecol(four_cols, main = "Four named colors with added transparency")![]()
Setting opacity for comparing of multiple color palettes:
seecol("grad", alpha = 0.67, main = "Seeing transparent color palettes")![]()
Creating and comparing custom palettes
Suppose we want to compare a newly created color palette to existing
color palettes. To achieve this, advanced users can use the
seecol() function for displaying and comparing different
custom palettes. When provided with a list of color palettes as the
input to its pal argument, seecol() will show
a comparison of the inputs:
# Define 2 palettes:
pal1 <- c(rev(pal_seeblau), "white", pal_bordeaux)
pal2 <- usecol(c(Karpfenblau, Seeblau, "gold"), n = 10)

# Show the my_pair palette from above, the 2 palettes just defined, and 2 pre-defined palettes:
seecol(list(my_pair, pal1, pal2, pal_unikn, pal_unikn_pair))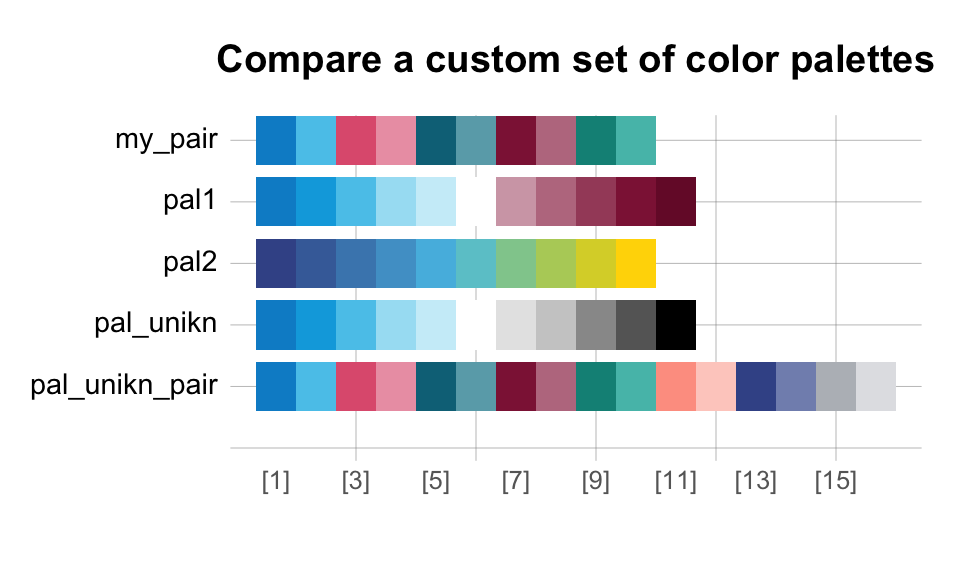
Note that unknown color palettes are named
pal_,
in increasing order. Palettes known to seecol() are labeled
by their respective names. Labeling only custom palettes works by
setting the pal_names argument to a character vector of
appropriate length:
seecol(list(my_pair, pal1, pal2, pal_unikn, pal_unikn_pair),
       pal_names = c("my_pair", "blue_bord", "blue_yell"),
       main = "Labeling custom color palettes")
If the pal_names argument is specified and corresponds
to the length of all color palettes, the default names of all
color palettes are overwritten by pal_names:
seecol(list(my_pair, pal1, pal2, pal_unikn, pal_unikn_pair),
       pal_names = c("my_pair", "blue_bord", "blue_yell", "blue_black", "mix_pair"),
       main = "Comparing and labeling custom color palettes")
As before, we can use lower values of n for
truncating/obtaining shorter subsets of color palettes:
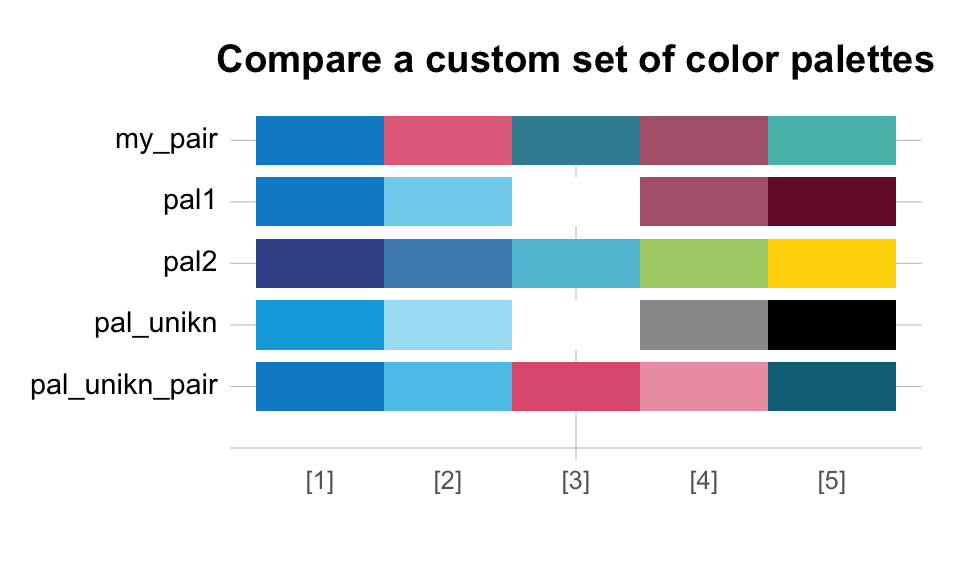
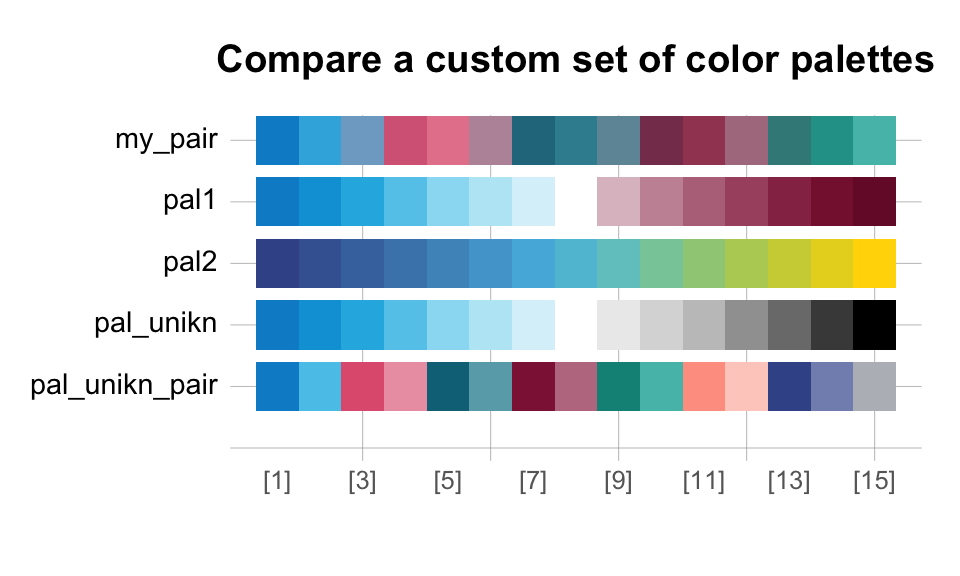
or higher values of n for extending color palettes:
Finding colors
Two familiar color search tasks are addressed by the
simcol() and grepal() functions:
-
simcol()allows searching for colors that are similar to a given target color -
grepal()allows searching for colors whose names match some pattern
Finding similar colors with simcol()
Assuming that our favorite color is "deeppink", a good
question is: How can we find similar colors? Given some target color,
the simcol() function searches through a set of colors to
find and return visually similar ones:
simcol("deeppink", plot = FALSE)
#>     deeppink    deeppink2      maroon1      maroon2   violetred1   violetred2
#>   "deeppink"  "deeppink2"    "maroon1"    "maroon2" "violetred1" "violetred2"
By default, simcol() searches though all named R colors
of colors() (of the grDevices package),
but adjusting the col_candidates and tol
arguments allows for more fine-grained searches:
simcol("deepskyblue", col_candidates = pal_seeblau, tol = c(50, 50, 100))
#>   deepskyblue      seeblau3      seeblau4      seeblau5
#> "deepskyblue"     "#59C7EB"     "#00A9E0"     "#008ECE"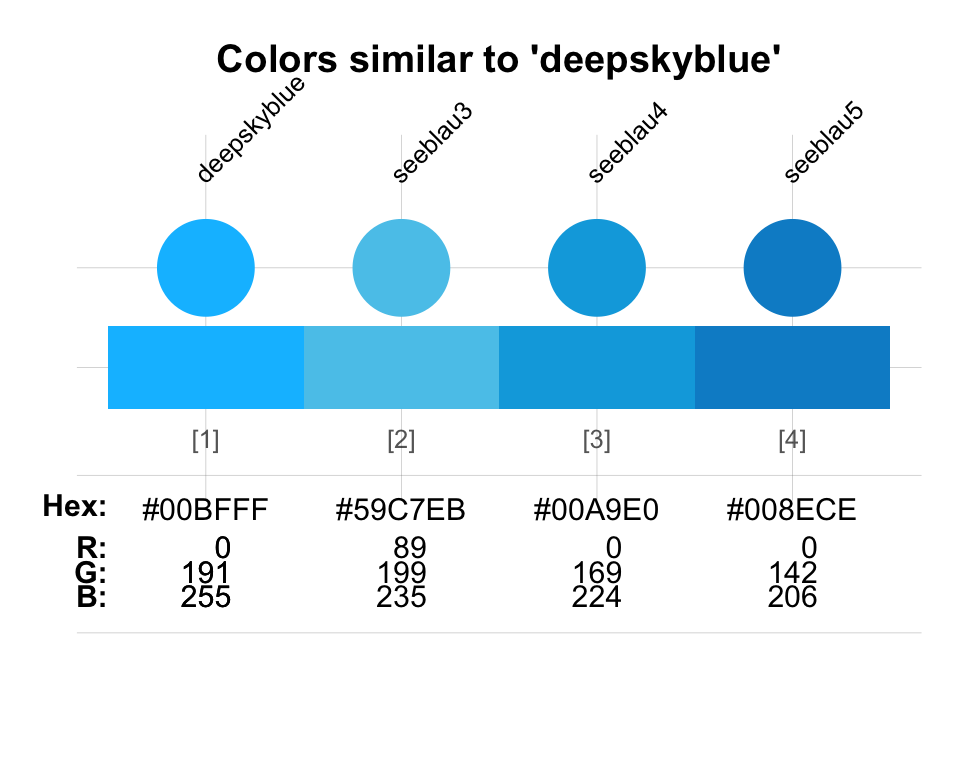
Finding color names with grepal()
We often search for some particular color hue (e.g., some sort of
purple), but also know that the particular color named “purple” is
not the one we want. Instead, we would like to see all colors
that contain the keyword “purple” in its name. The grepal()
function addresses this need:
grepal("purple") # get & see 10 names of colors() with "purple" in their name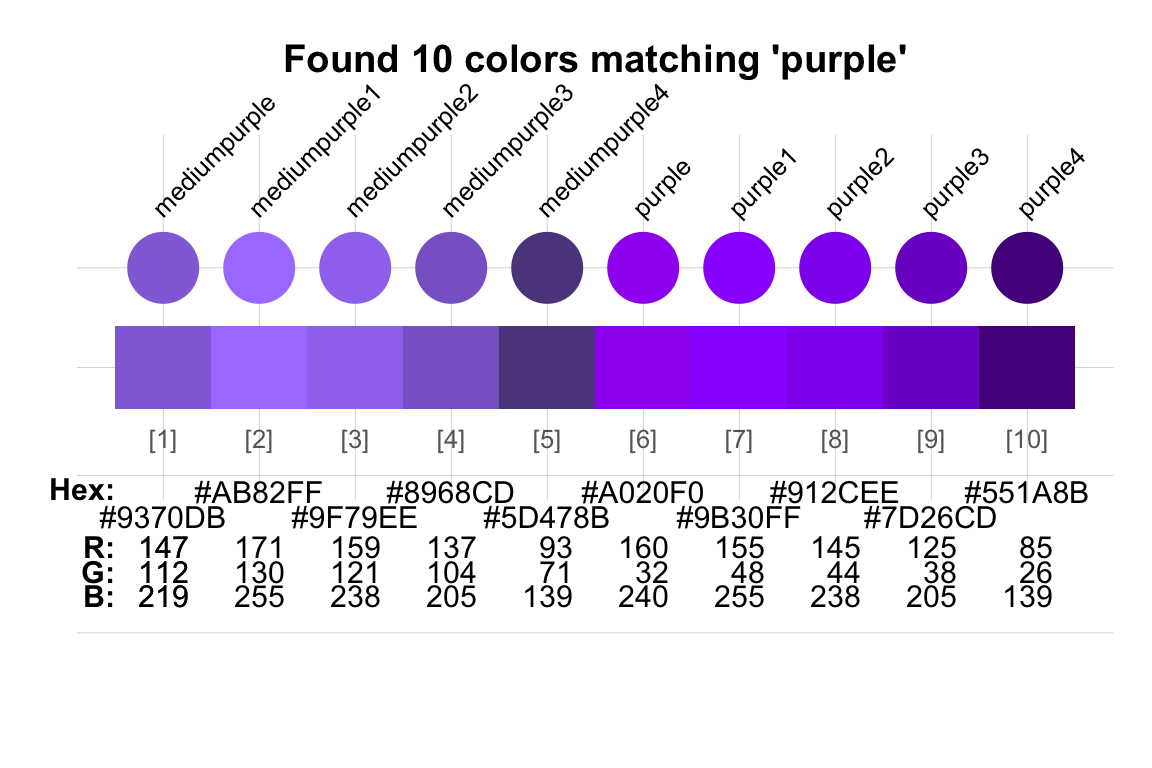
#>  [1] "mediumpurple"  "mediumpurple1" "mediumpurple2" "mediumpurple3"
#>  [5] "mediumpurple4" "purple"        "purple1"       "purple2"
#>  [9] "purple3"       "purple4"
Note that the grepal() function allows searching color
names by regular expressions:
length(grepal("gr(a|e)y", plot = FALSE))    # shades of "gray" or "grey"
#> [1] 224
length(grepal("^gr(a|e)y", plot = FALSE))   # shades starting with "gray" or "grey"
#> [1] 204
length(grepal("^gr(a|e)y$", plot = FALSE))  # shades starting and ending with "gray" or "grey"
#> [1] 2
By default, grepal() searches the vector of named colors
x = colors() (of the grDevices package)
and plots its results (as a side effect). However, it also allows for
searching color palettes provided as data frames (with color names) and
for suppressing the visualization (by setting
plot = FALSE):
grepal("see", pal_unikn) # finding "see" in (the names of) pal_unikn (as df)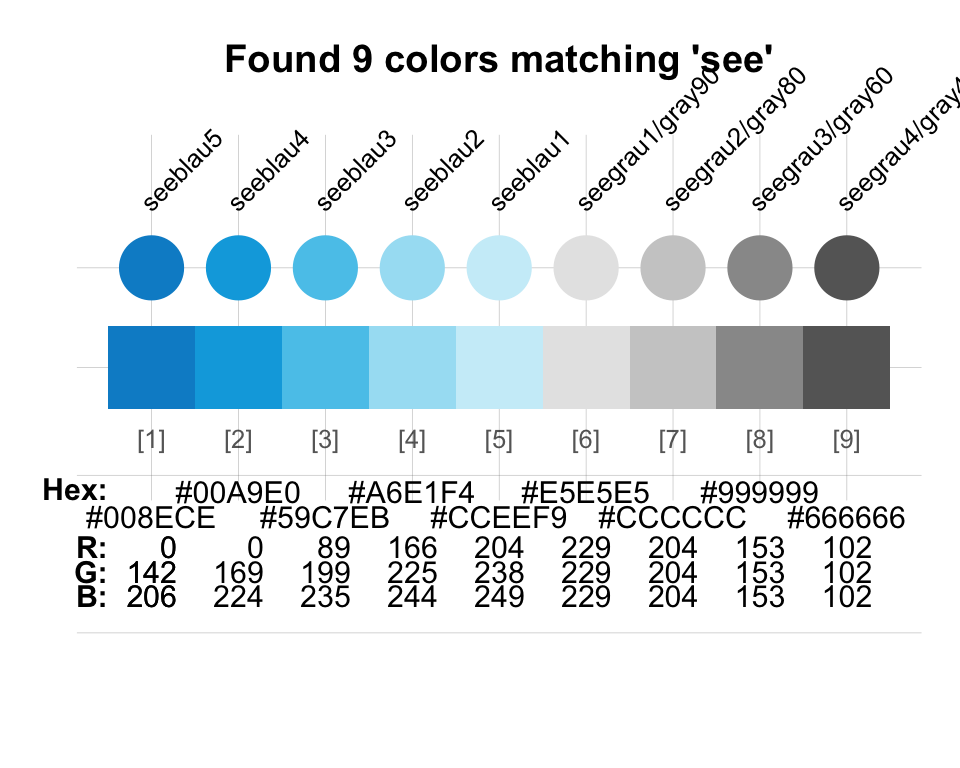
#>   seeblau5 seeblau4 seeblau3 seeblau2 seeblau1 seegrau1 seegrau2 seegrau3
#> 1  #008ECE  #00A9E0  #59C7EB  #A6E1F4  #CCEEF9  #E5E5E5  #CCCCCC  #999999
#>   seegrau4
#> 1  #666666
grepal("blau", pal_unikn_pref, plot = FALSE)  # finding "blau" in pal_unikn_pref
#>   Seeblau Karpfenblau
#> 1 #59C7EB     #3E5496
Auxiliary color functions
Adjusting transparency with ac()
The ac() function provides a flexible wrapper around the
adjustcolor() function of the grDevices
package. Its key functionality is that it allows for
vectorized col and alpha
arguments:
my_cols <- c("black", "firebrick", "forestgreen", "gold", "steelblue")
seecol(ac(my_cols, alpha = c(rep(.25, 5), rep(.75, 5))))![]()
The name ac is an abbreviation of “adjust color”, but
also a mnemonic aid for providing “air conditioning”.
Creating color gradients with shades_of()
We have seen that the main usecol() function allows
stretching and squeezing color palettes and thus creating complex color
gradients. An even simpler way for creating linear color gradients is
provided by the shades_of() function:
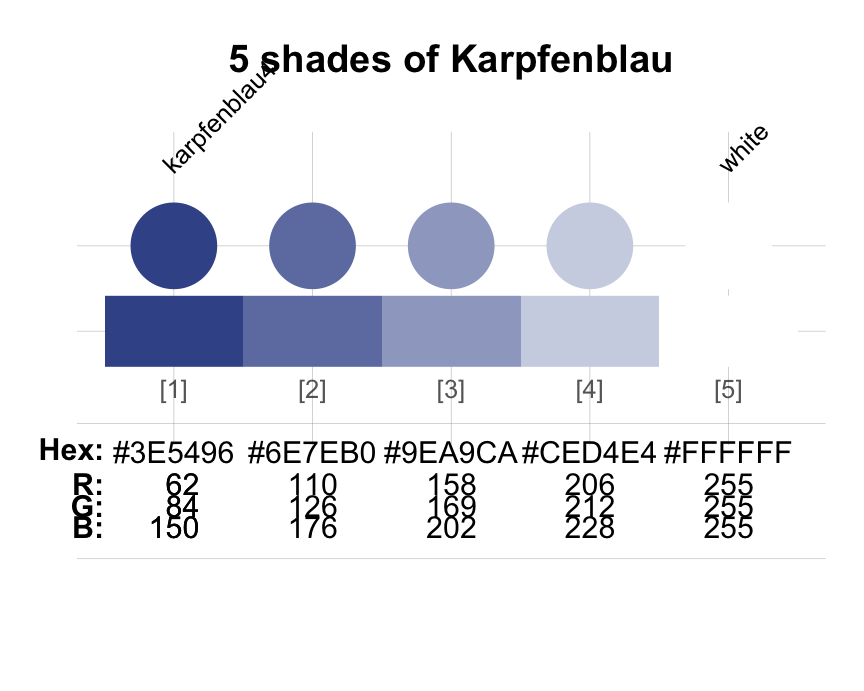
Internally, shades_of() is just a convenient wrapper for
a special usecol() function. The limitation of
shades_of() is that it only allows creating bi-polar color
palettes (i.e., gradients between two colors). When the final color
col_n is unspecified, its default of “white” is used (as in
the example). By contrast, the usecol() function allows
creating color gradients between an arbitrary number of colors. Thus,
the following two expressions define the same bi-polar color
palette:
pg_1 <- usecol(c("deeppink", "gold"), 5)
pg_2 <- shades_of(5, "deeppink", "gold")
all.equal(pg_1, pg_2)
#> [1] TRUE

seecol(pg_2, main = "A bi-polar color gradient")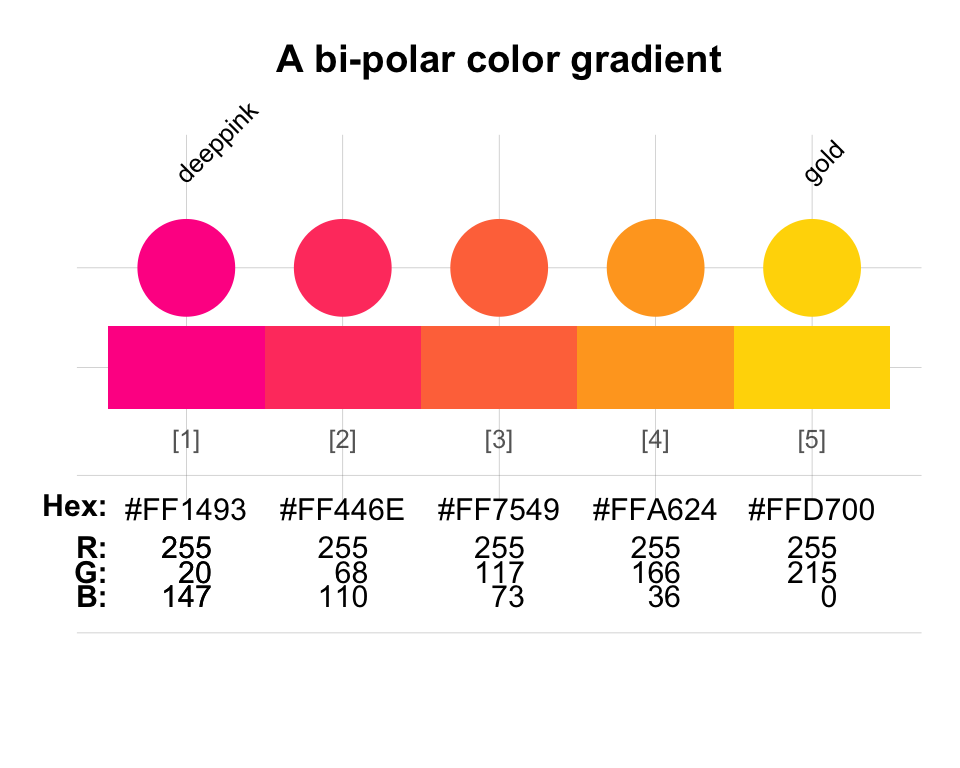
Defining color palettes with newpal()
Having created, combined or found all those beautiful colors, we may
wish to define a new color palette. Defining a new named color palette
allows to consistently access and apply colors (e.g., to a series of
visualizations in a report or publication). The newpal()
function makes it easy to define color palettes:
col_flag <- c("#000000", "#dd0000", "#ffce00")  # source: www.schemecolor.com

flag_de  <- newpal(col = col_flag,
                   names = c("black", "red", "gold"))

seecol(flag_de, main = "Defining a flag_de color palette")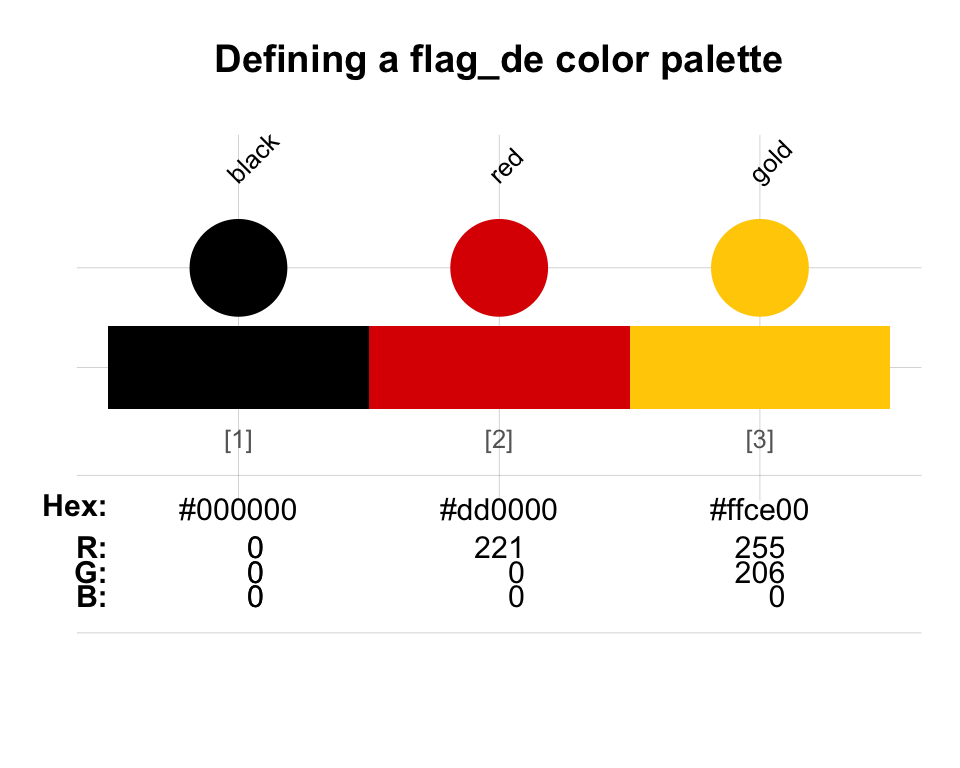
By default, newpal() returns the new color palette as a
(named) vector. Setting as_df = TRUE returns a data
frame.
Illustrating color palettes with demopal()
After choosing, creating or modifying a color palette, we usually
inspect the result with seecol(). Alternatively, we can use
the demopal() function to use a color
palette pal in a visualization. Currently, the
type argument supports the following visualizations:
- “bar”: A bar plot
- “curve”: A plot of normal distribution curves (with transparency)
- “mosaic”: A mosaic/table plot
- “polygon”: An area/polygon plot
- “scatter”: A scatter plot of points (with transparency)
All types of demopal() invisibly return their (randomly
generated) data and accept some graphical arguments (e.g.,
col_par and alpha), a scaling n
and a seed value (for reproducible results), as well as
main and sub arguments (for setting plot
titles). Some functions additionally accept type-specific arguments
(e.g., logical beside, horiz, and
as_prop arguments for plot type = "bar").
demopal(pal = pg_2, type = 3)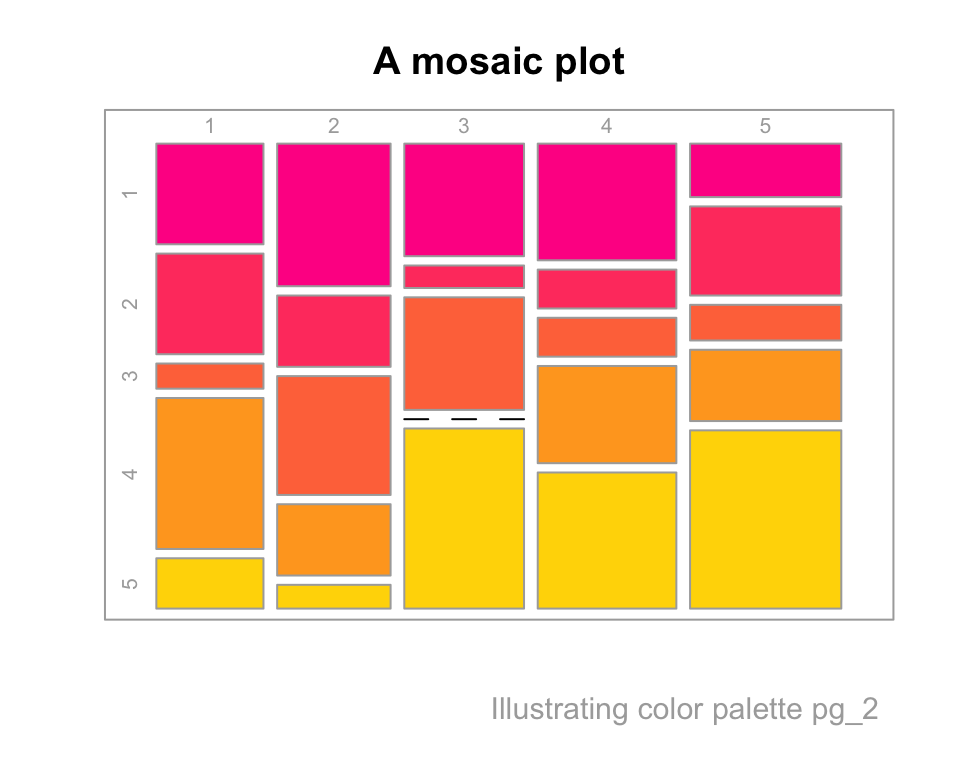
This concludes our quick tour through the colors and color functions of the unikn package. We hope that they enable you to find, design, and use beautiful color palettes — and spice up your visualizations by vivid and flamboyant colors!
Resources
The following versions of unikn and corresponding resources are currently available:
| Type: | Version: | URL: |
|---|---|---|
| A. unikn (R package): | Release version | https://CRAN.R-project.org/package=unikn |
| Development version | https://github.com/hneth/unikn/ | |
| B. Online documentation: | Release version | https://hneth.github.io/unikn/ |
| Development version | https://hneth.github.io/unikn/dev/ |
Vignettes
The following vignettes provide instructions and examples for using the unikn colors, color palettes, and functions:
| Nr. | Vignette | Content |
|---|---|---|
| 1. | Colors | Colors and color functions |
| 2. | Color recipes | Recipes for color-related tasks |
| 3. | Institutional colors | Creating color palettes for other institutions |
| 4. | Text | Text boxes and decorations |