uline plots 1 or more text strings (provided as a character vector labels)
to an (existing or new) plot and places a colored line underneath
each label (to underline it).
uline(
  labels,
  x = 0,
  y = 0.55,
  x_layout = NA,
  y_layout = "even",
  col = "black",
  col_bg = Seeblau,
  cex = 1.5,
  font = 1,
  new_plot = "none"
)
Arguments
- labels
A character vector specifying the text labels to be plotted.
- x
A numeric vector of x-coordinates at which the text labels in
labelsshould be written. If the lengths ofxandydiffer, the shorter one is recycled. Default:x = 0.- y
A numeric vector of y-coordinates at which the text labels in
labelsshould be written. If the lengths ofxandydiffer, the shorter one is recycled. Default:y = .55.- x_layout
An optional numeric vector or character string to control the horizontal positions of
labels. Numeric values are interpreted as increments to values ofxand recycled (to enable stepwise or alternating patterns). 3 character string options are:"center"(i.e., center wrt. first label or plot center),"left"(i.e., left wrt. first label or plot center),"right"(i.e., right wrt. first label or plot center). Default:x_layout = NA(i.e., using values ofx).- y_layout
A numeric value or character string to control the vertical positions of
labels. Numeric values are interpreted as increments to values ofy[1]and recycled (to enable stepwise or alternating patterns). 2 character string options are:"even"(i.e., even distribution of labels across available y-space) and"flush"(i.e., no space between adjacent labels, i.e.,y_layout = 0). Default:y_layout = "even".- col
The color(s) of the text label(s). Default:
col_lbl = "black".- col_bg
The color(s) of the line (under the text labels of
labels). Default:col_bg = Seeblau.- cex
Numeric character expansion factor(s), multiplied by
par("cex")to yield the character size(s). Default:cex = 1.5.- font
The font type(s) to be used. Default:
font = 1(i.e., plain text).- new_plot
Boolean: Should a new plot be generated? Set to
"blank"or"slide"to create a new plot. Default:new_plot = "none"(i.e., add to an existing plot).
Details
The positions of the text elements in labels can be specified by
providing their coordinates (as x and y arguments) or
by providing an initial position and an y_layout (see below).
Text formatting parameters (like col, col_bg, cex, font)
are recycled to match length(labels).
uline uses the base graphics system graphics::.
See also
Examples
uline(labels = "This is a test.", new_plot = "blank") # create a new blank plot
uline(labels = "More testing here...", y = .33, col_bg = pal_pinky[[2]]) # add to plot
 # 2 basic cases:
# (a) Underline text on an existing plot:
plot(x = 0, y = 0, type = "n", xlim = c(0, 1), ylim = c(0, 1), xlab = "", ylab = "")
uline(x = 0, y = .8, labels = "Underline text (on an existing plot)") # add to plot
# 2 basic cases:
# (a) Underline text on an existing plot:
plot(x = 0, y = 0, type = "n", xlim = c(0, 1), ylim = c(0, 1), xlab = "", ylab = "")
uline(x = 0, y = .8, labels = "Underline text (on an existing plot)") # add to plot
 # (b) Underline text on a new plot:
uline(x = .02, y = .80, labels = "Underline text (on a new plot)",
new_plot = "slide") # create a new plot
# (b) Underline text on a new plot:
uline(x = .02, y = .80, labels = "Underline text (on a new plot)",
new_plot = "slide") # create a new plot
 # Example:
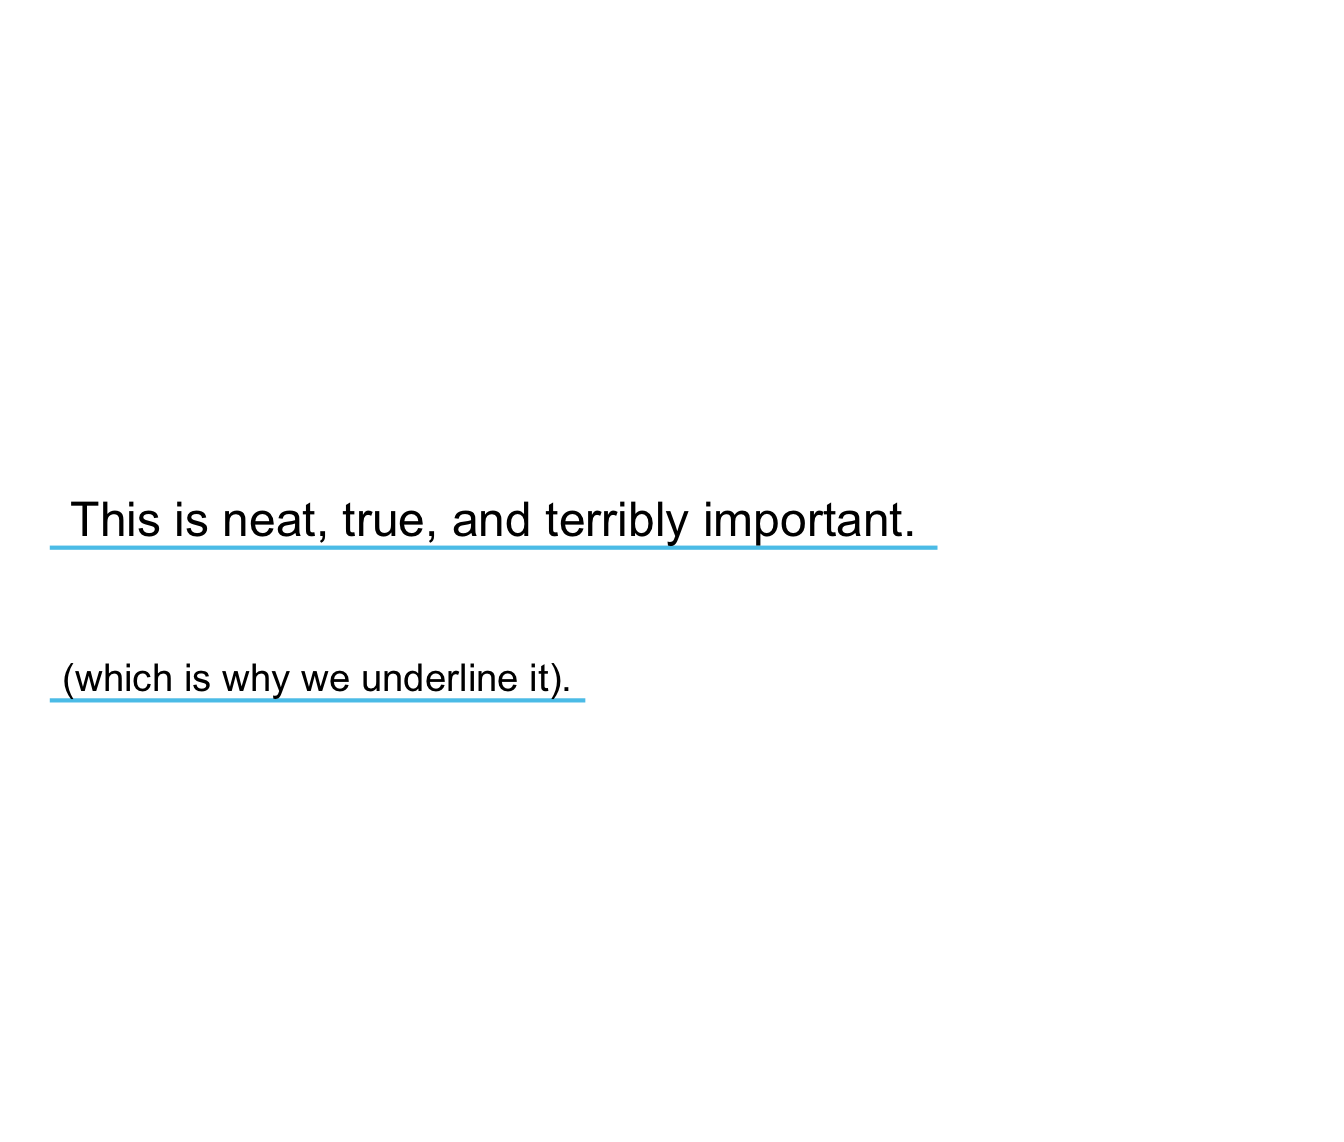
lbl_line <- c("This is neat, true, and terribly important.")
uline(labels = lbl_line, new_plot = "blank") # create a new plot
uline(labels = "(which is why we underline it).", y = .40, cex = 1.2) # add to plot
# Example:
lbl_line <- c("This is neat, true, and terribly important.")
uline(labels = lbl_line, new_plot = "blank") # create a new plot
uline(labels = "(which is why we underline it).", y = .40, cex = 1.2) # add to plot